20/08/2023
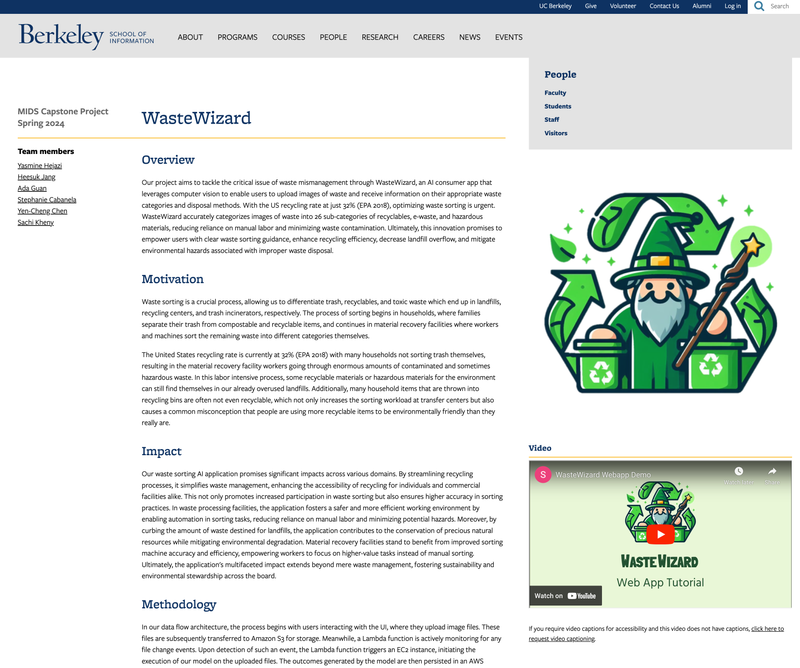
WasteWizard with Computer Vision - UC Berkeley, 2024 (Capstone Project)
[https://www.ischool.berkeley.edu/projects/2024/wastewizard] ► In the backend, we utilized the Vision Transformer (ViT), our most effective model for waste item image classification, achieving a 90% macro F1 score, 91% precision, and 89% recall. This model efficiently classifies items as recyclable or non-recyclable, identifies their waste type, and calculates a result certainty score based on softmax logit probabilities. In the ML pipeline, I focused on data wrangling, cleansing, exploratory data analysis (EDA), and building other advanced models such as Convolutional Neural Networks (CNNs) and leveraging Transfer Learning techniques (e.g., ResNet50, VGG19) with various hyperparameter tuning strategies. ► Using AWS Amplify, AppSync, S3, DynamoDB, and EC2, I led the model deployment and developed a website that allows users to upload images and review the results generated by the model.
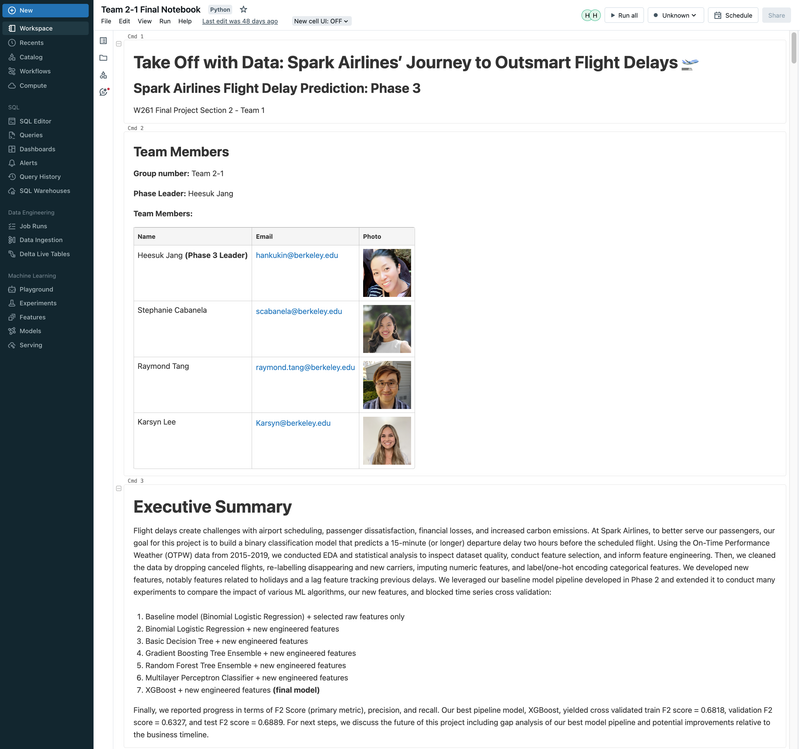
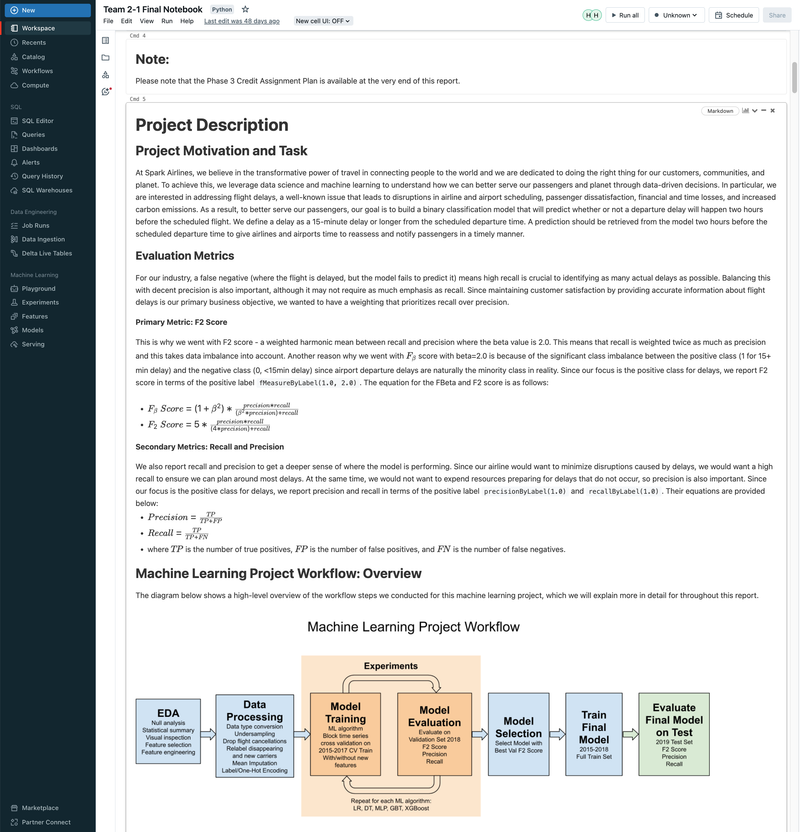
Flight Departure Delay with MLflow, Databricks, ML/DL Models, and GCP - UC Berkeley 2023
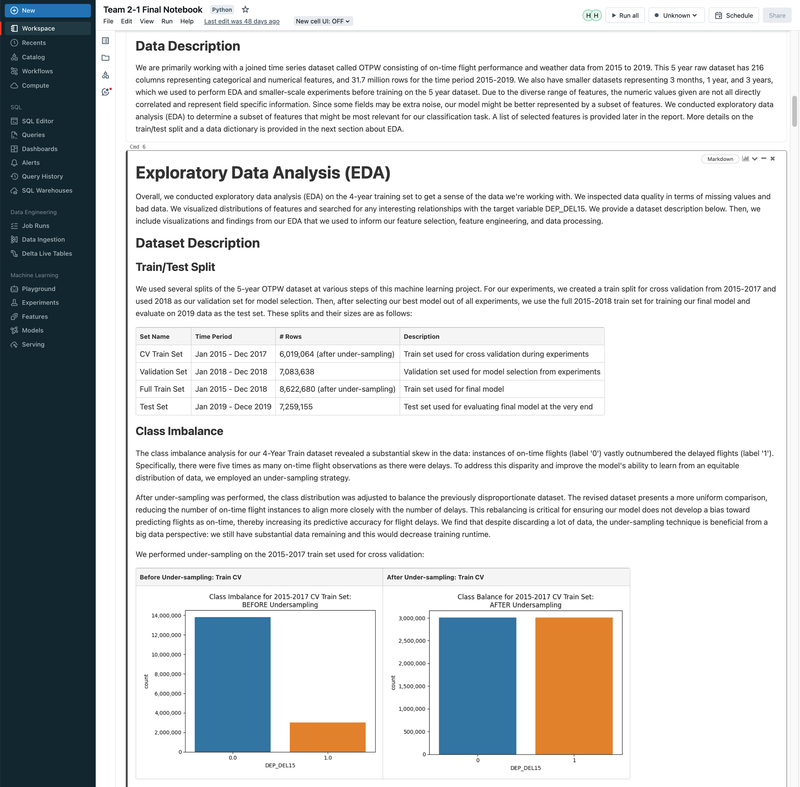
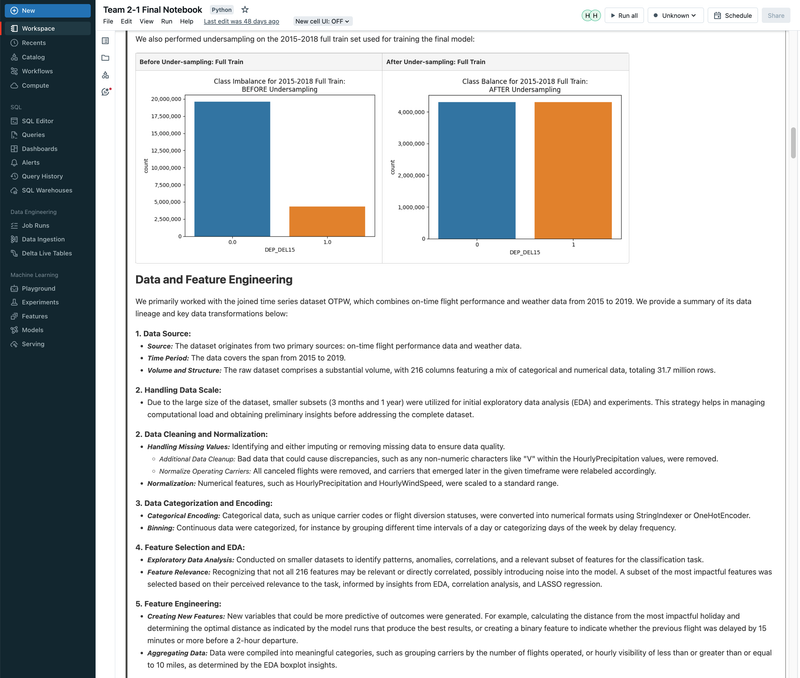
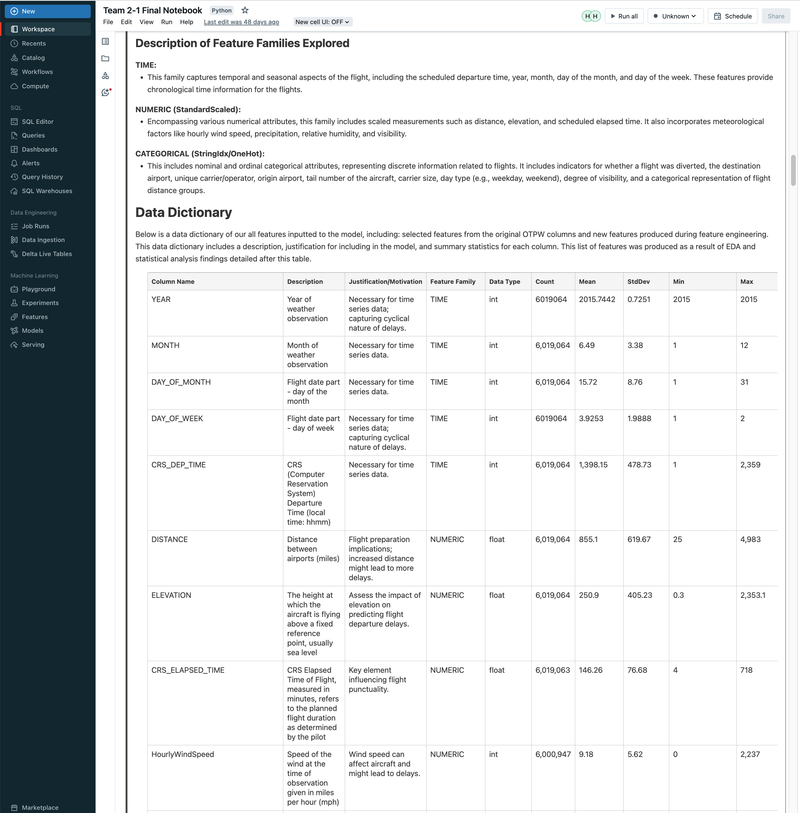
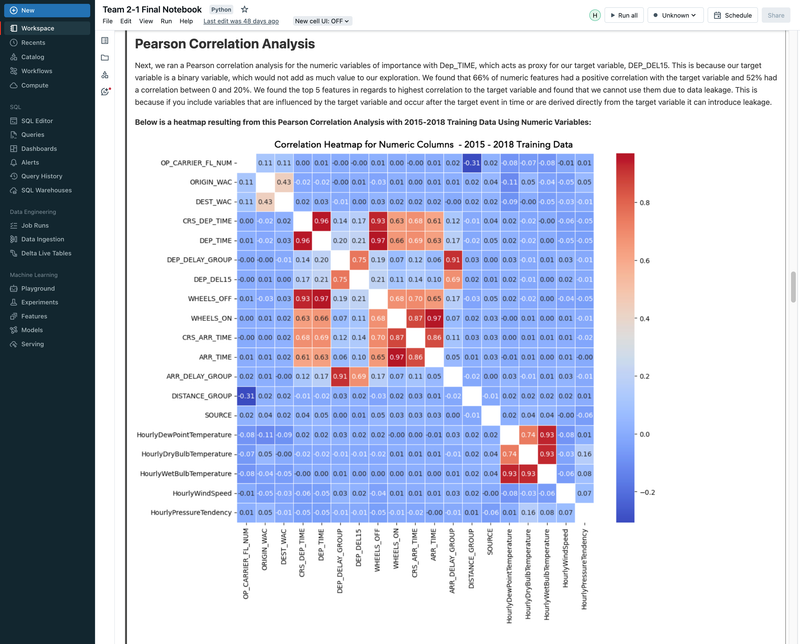
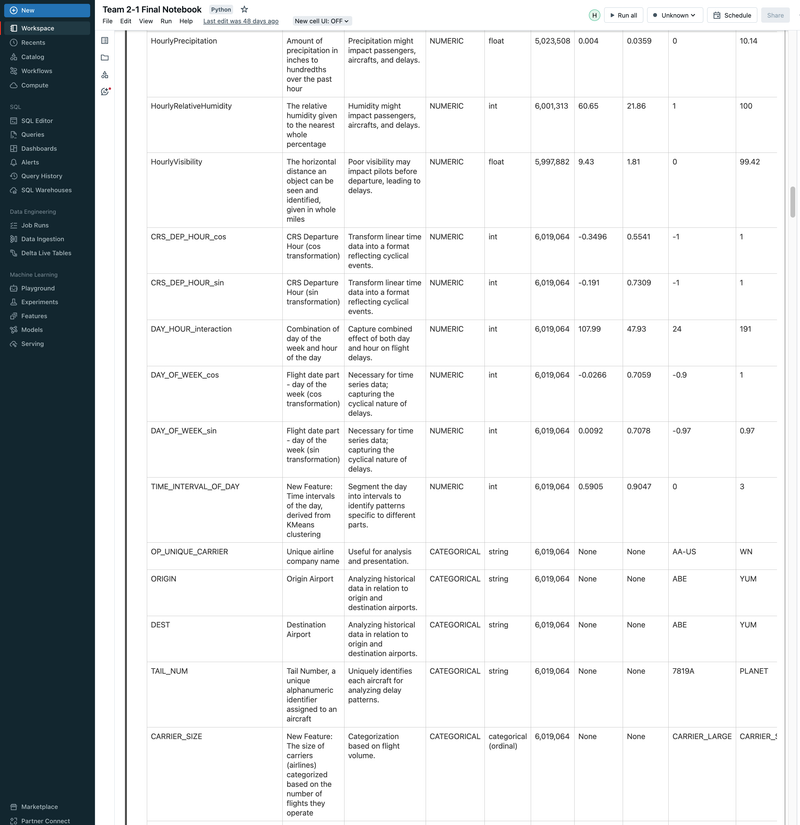
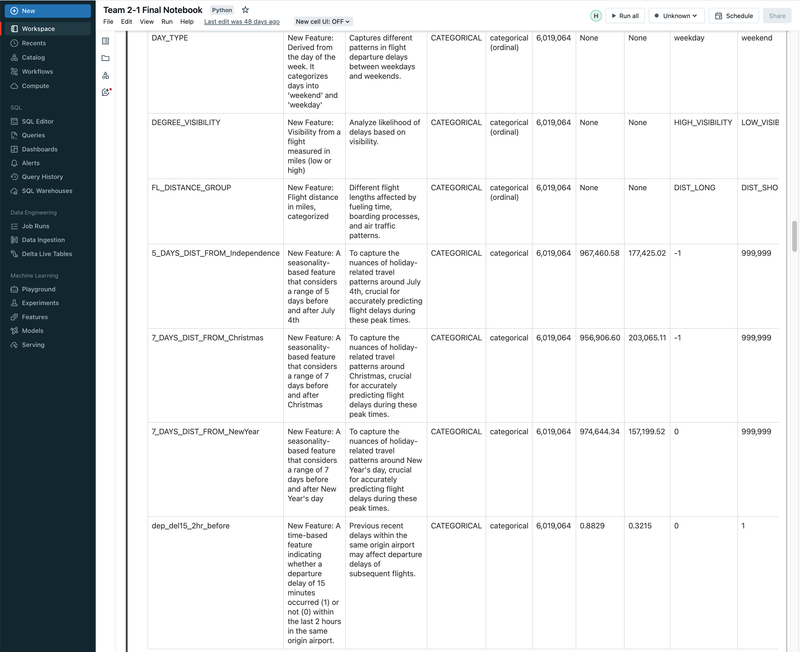
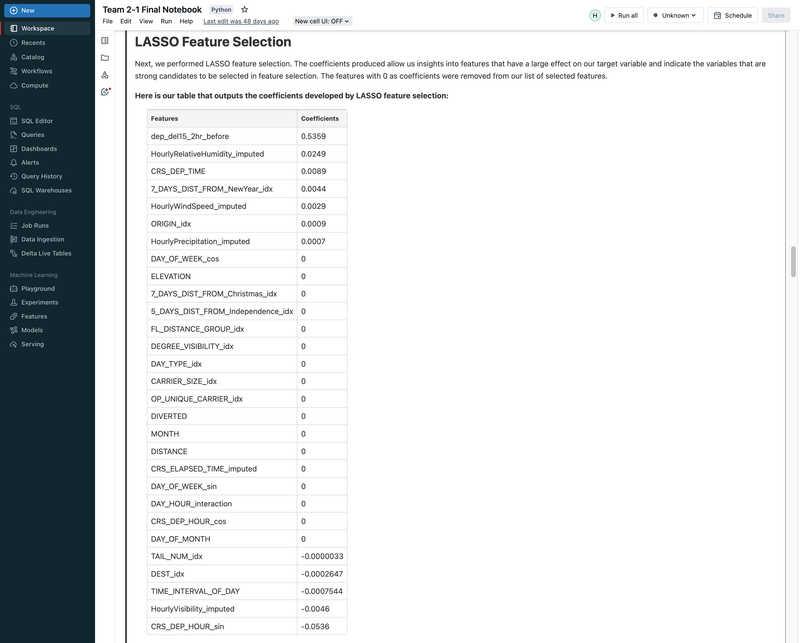
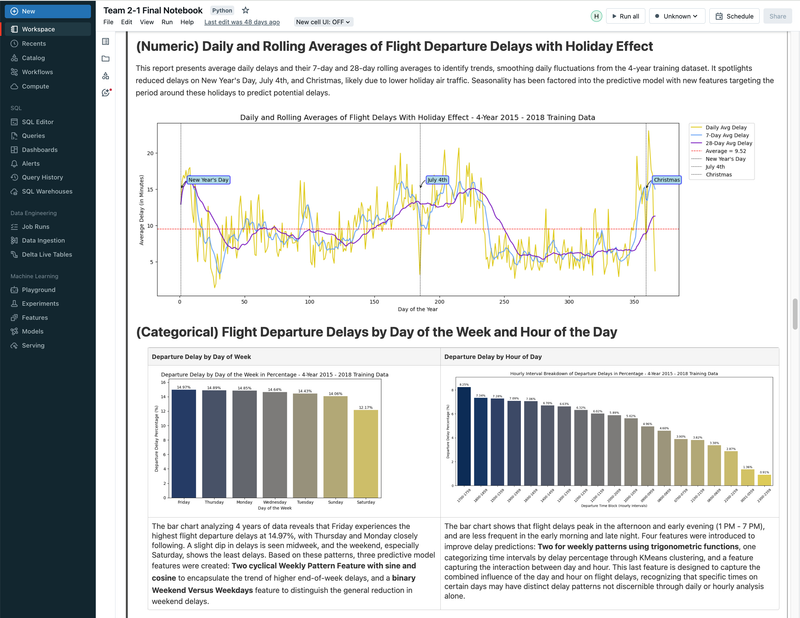
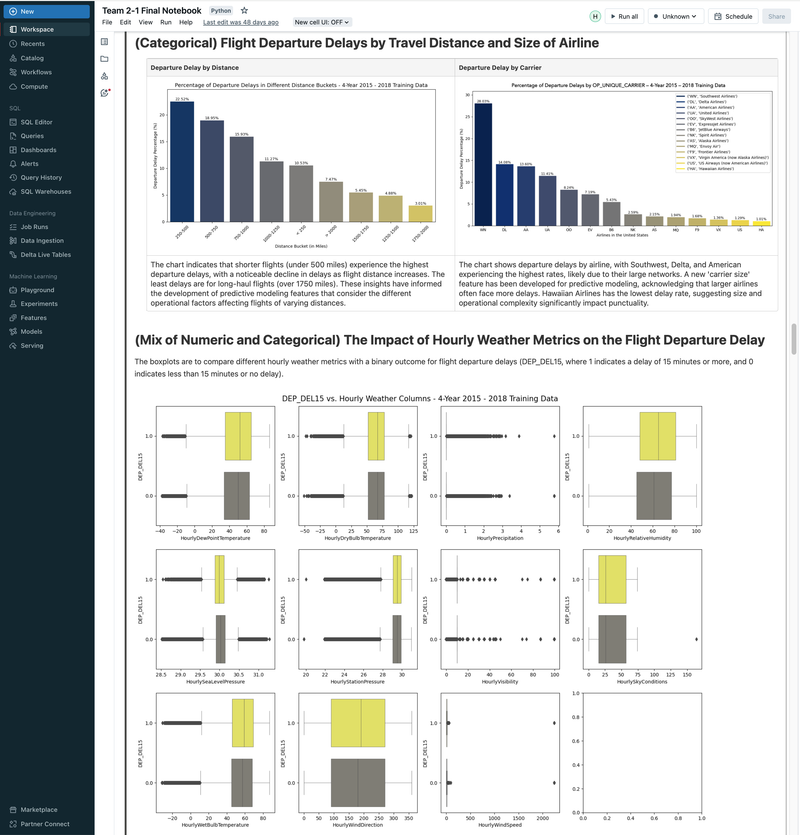
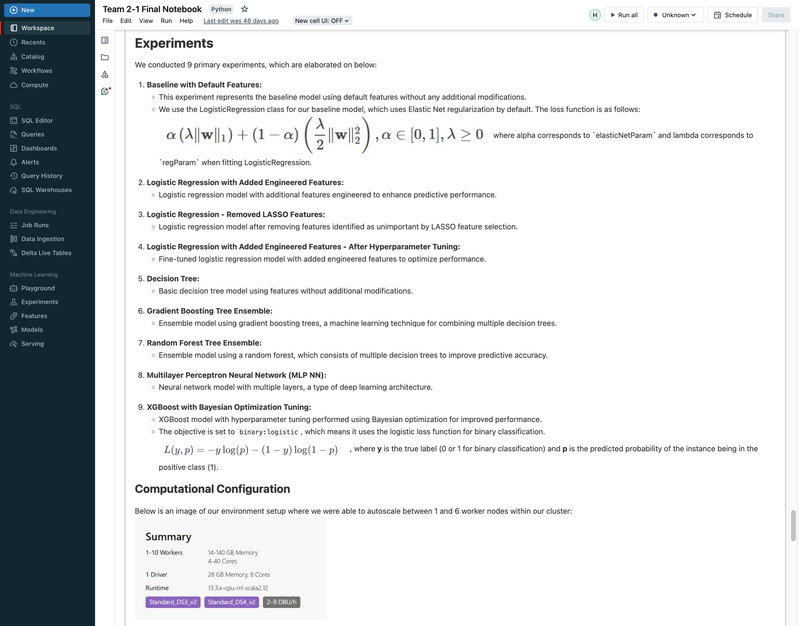
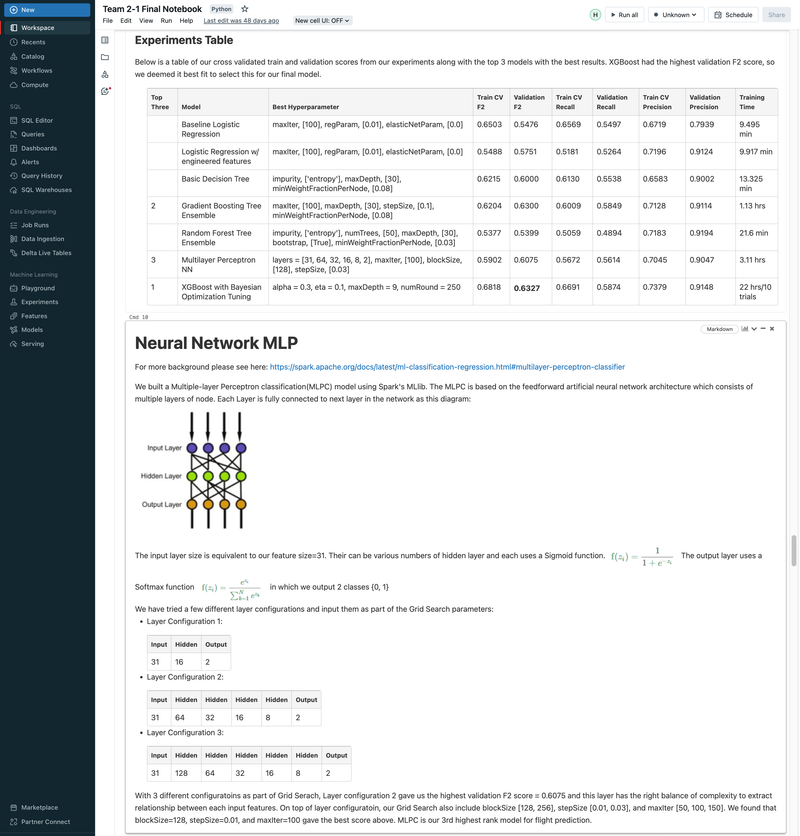
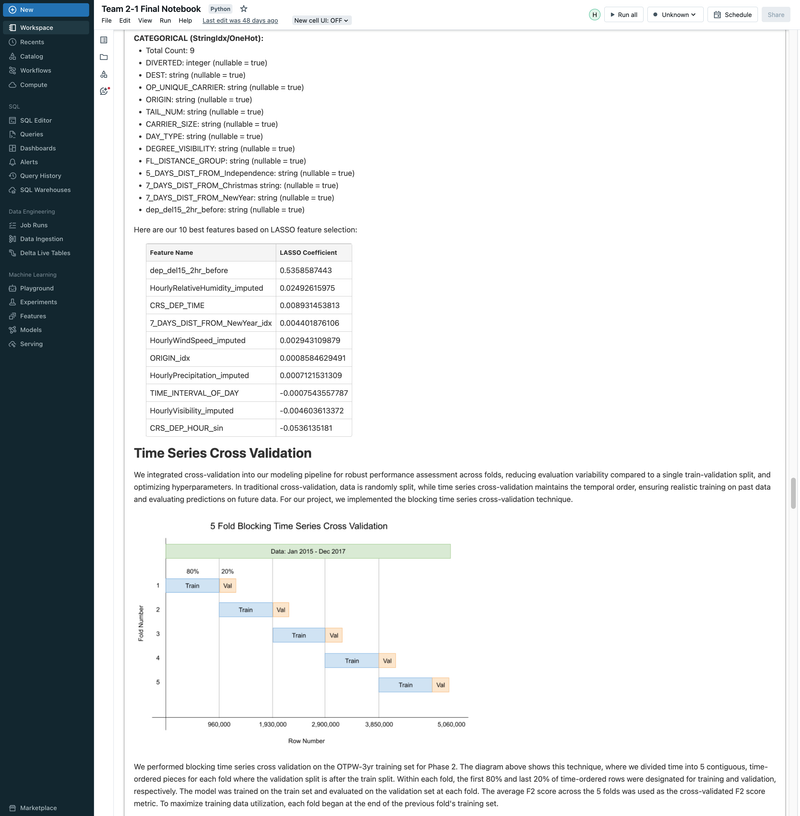
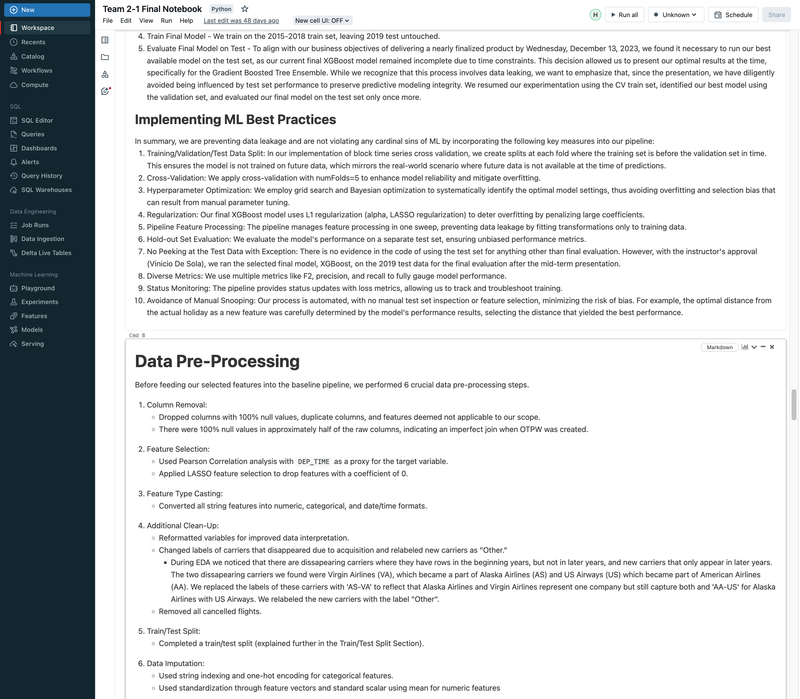
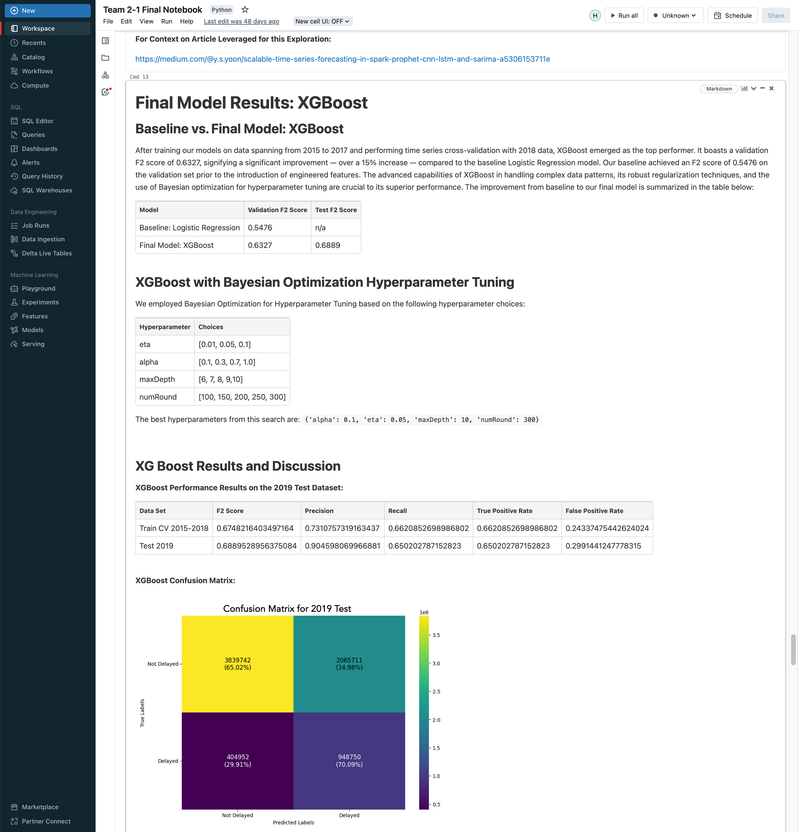
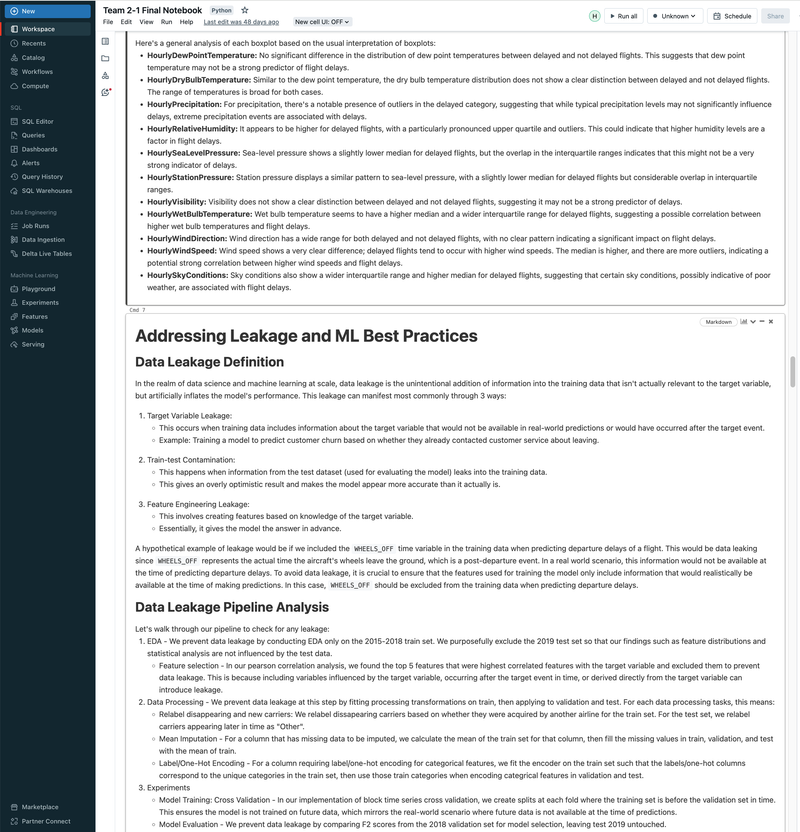
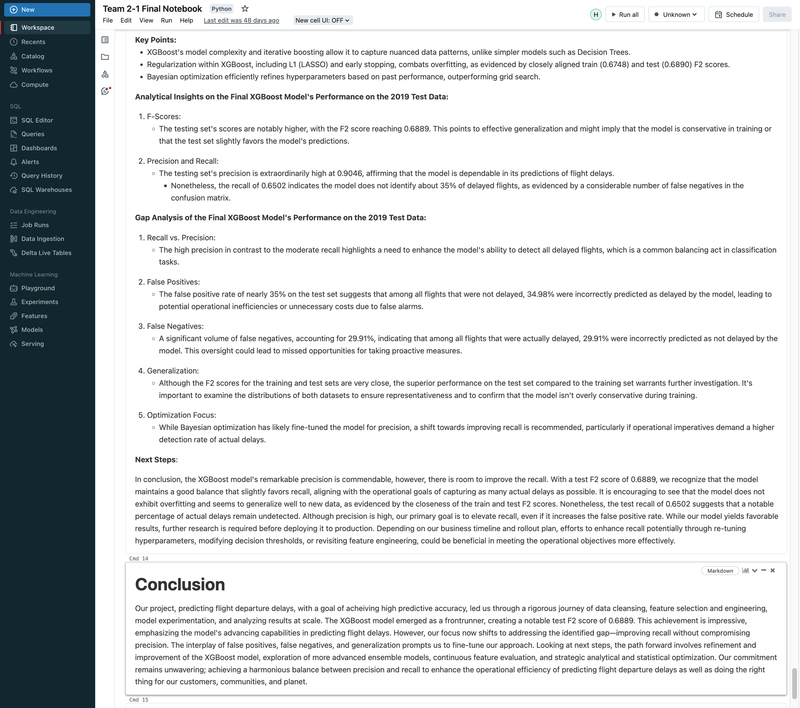
► Our team embarked on a project to predict flight delays of at least 15 minutes, two hours before their scheduled departure, using various machine and deep learning models. We analyzed and processed a comprehensive dataset of over 60 million records, spanning five years of flight and weather information. ► Our initial approach was logistic regression, serving as a baseline for this binary classification challenge. We then experimented with several models, including decision trees, random forests, XGBoost, CNNs, and MLPs, using block time series cross-validation. ► I led the exploratory data analysis (EDA) and feature engineering, introducing 10 innovative features. A significant contribution was in the development of an XGBoost model, where I applied Bayesian optimization for hyperparameter tuning. This method was instrumental in achieving the model's high performance, particularly an impressive F2 score of 69%, while avoiding overfitting and selection bias commonly associated with manual tuning.
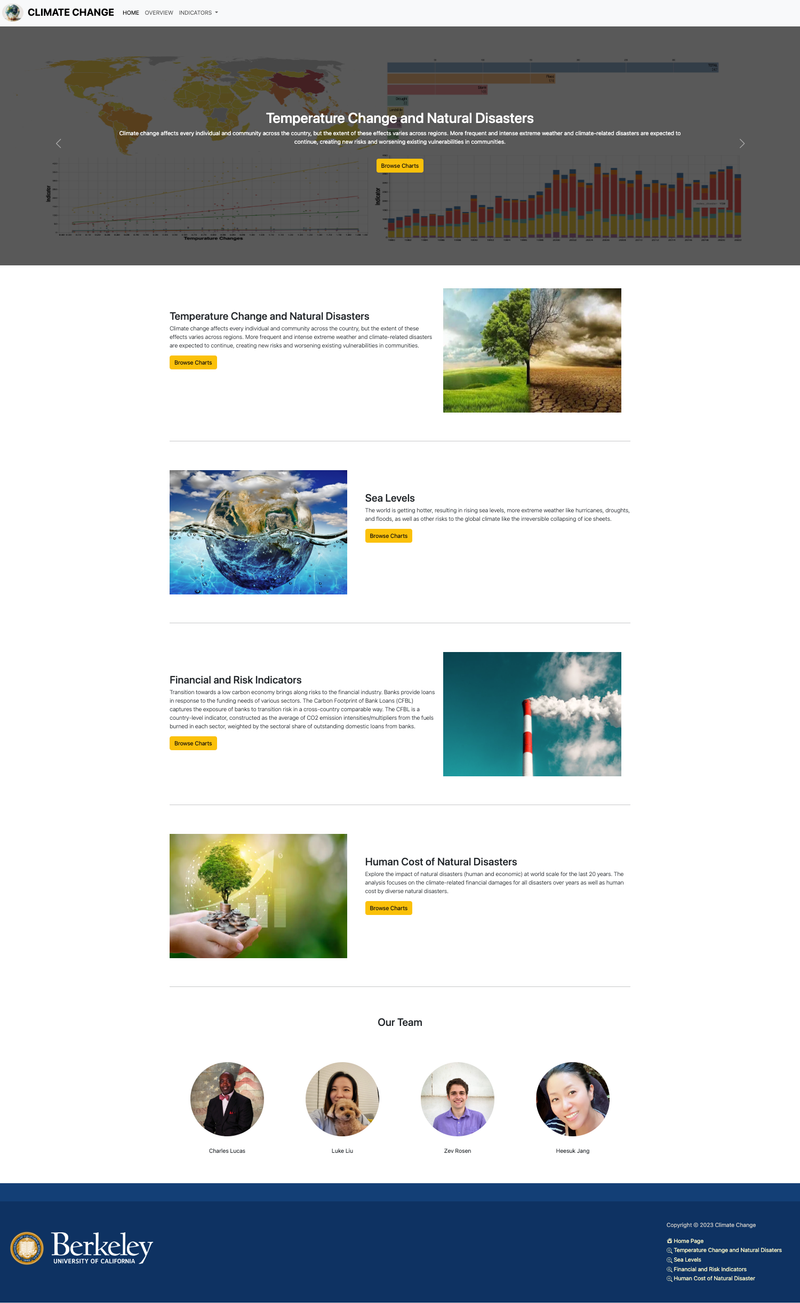
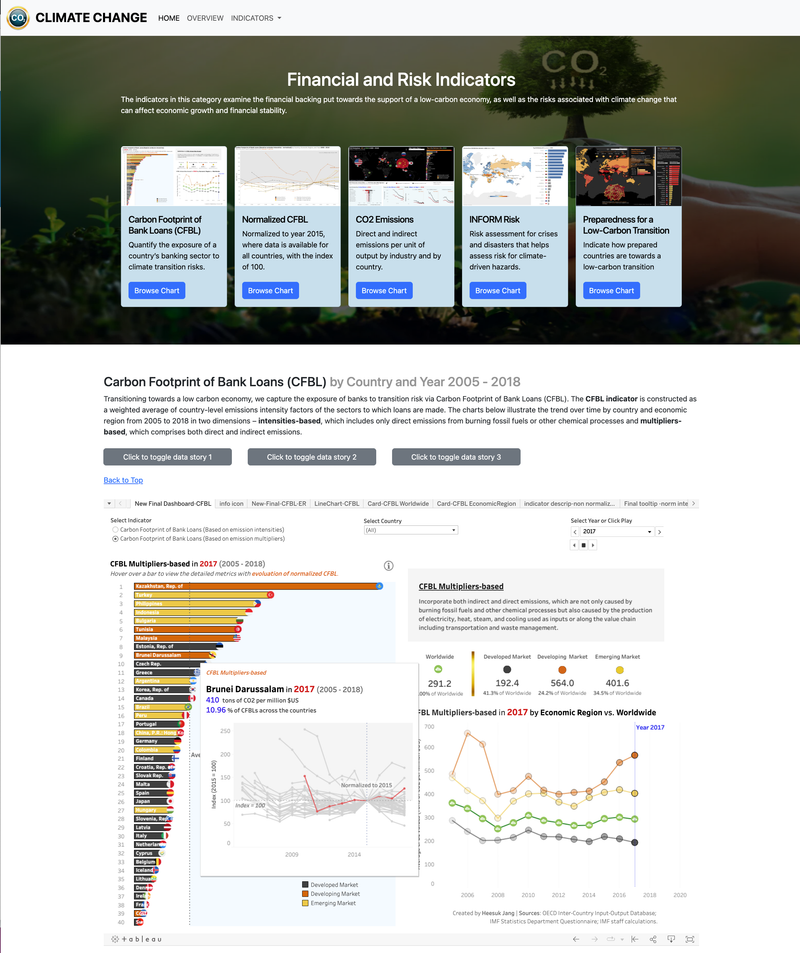
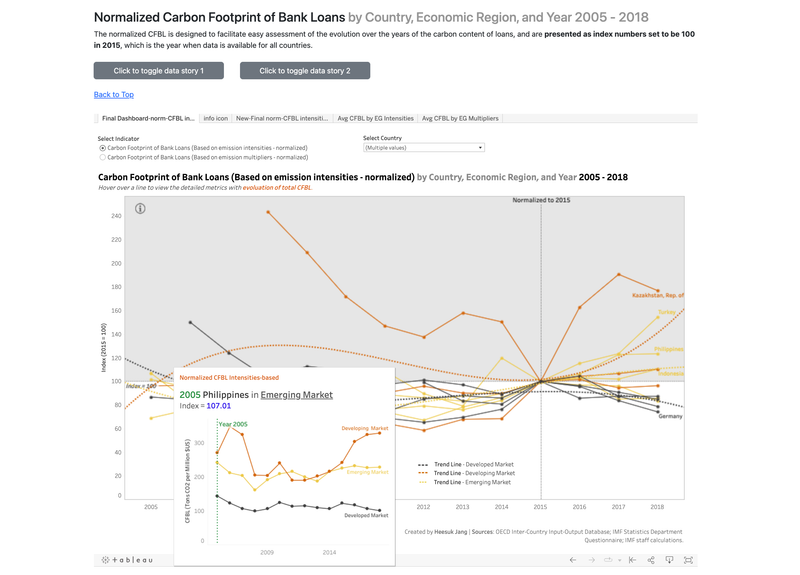
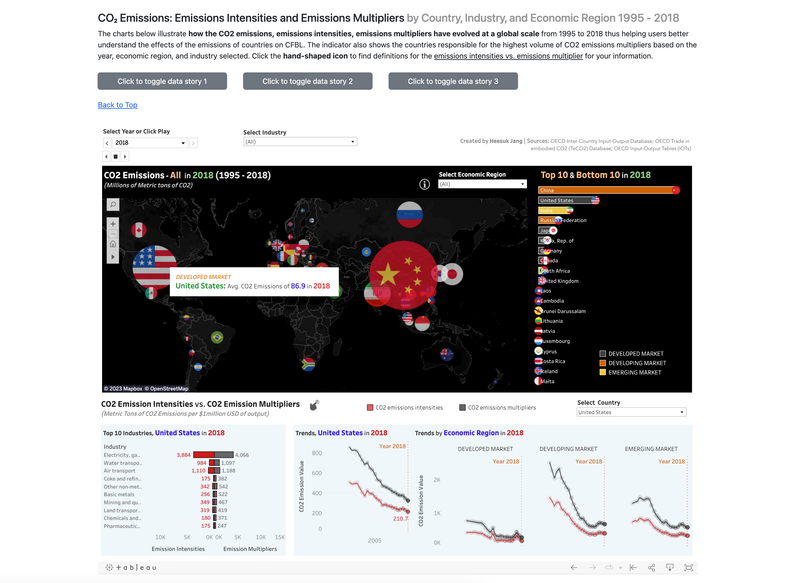
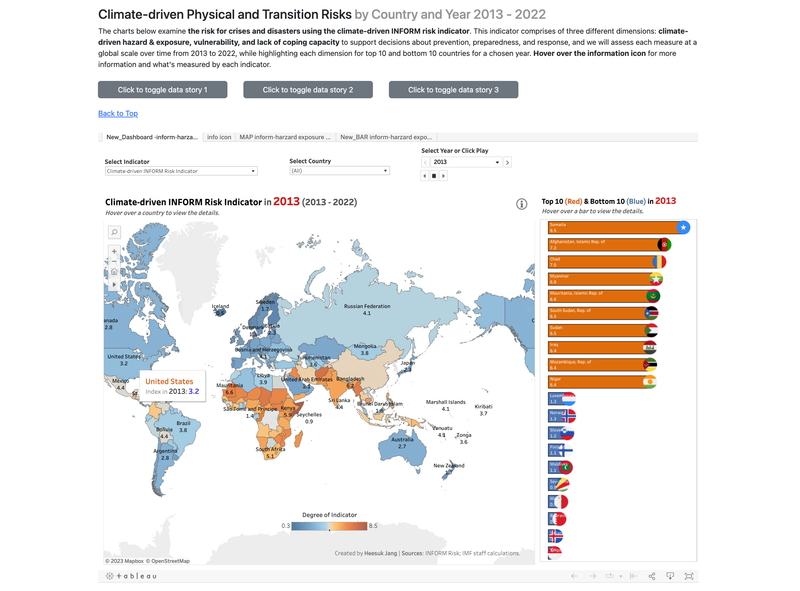
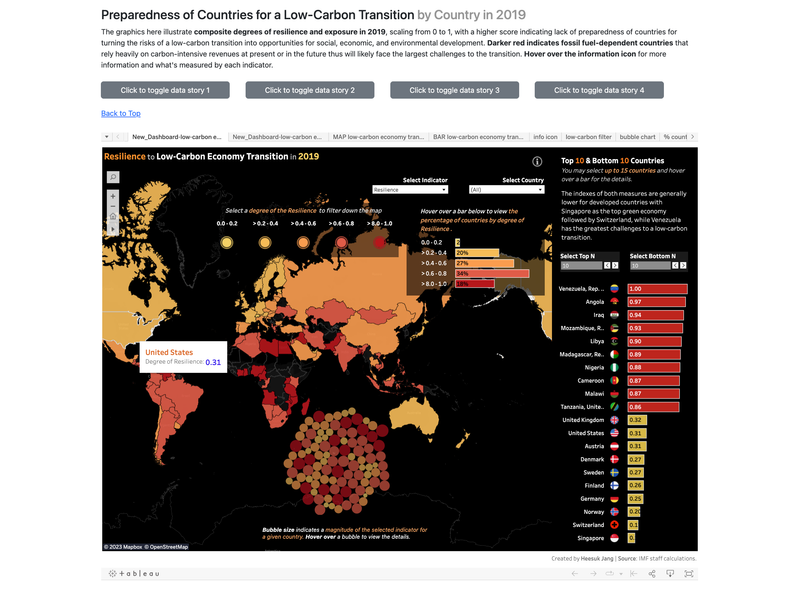
Climate Change Dashboard, UC Berkeley 2023
[Video Demo: https://drive.google.com/file/d/1b4dWghYWxcTrHJvncjXVlBWemisMCdLA/view] ► A group project for Data Visualization class at University of California, Berkeley. Using Tableau, D3.JS, and Vega-Altair, we examined/visualized the effects of climate change at a global scale, focusing on four KPIs - the insights to temperature change and climate-related disasters, rise in sea levels by region and country, trends in the financial and risk indicators towards a low-carbon transition, and damages and casualties of disasters from a financial perspective. ► As an individual contribution, I designed and provided the overall visualization of our website using Bootstrap, HTML, CSS, and JavaScript and focused on building "Financial and Risk Indicators" page, displaying Tableau-focused charts/graphs. Click the images below to enlarge.
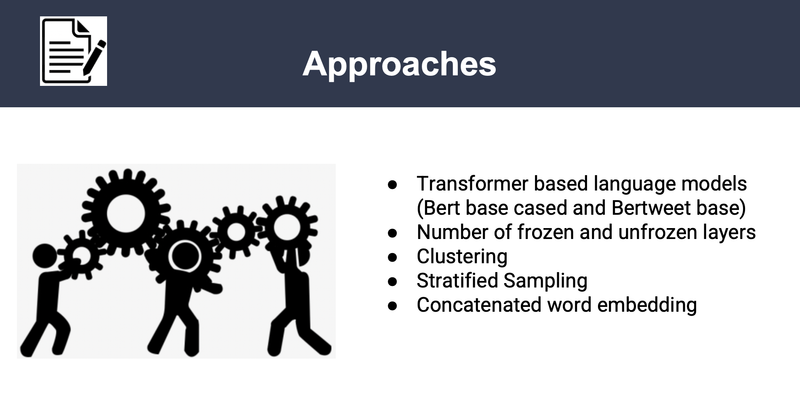
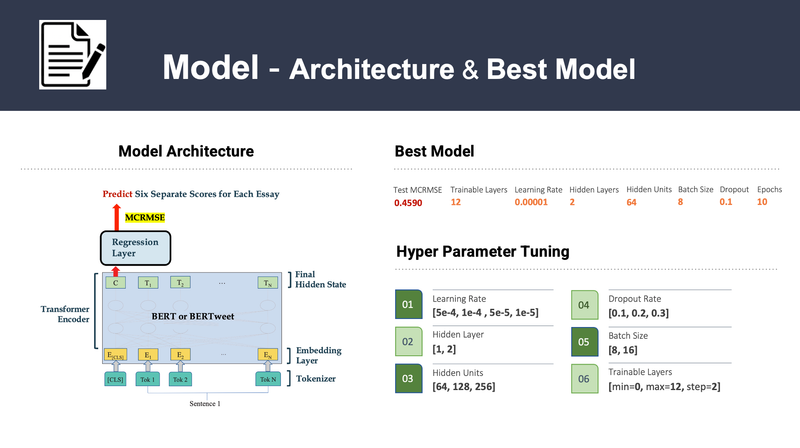
Improve English Essay with Artificial Intelligence, UC Berkeley 2023
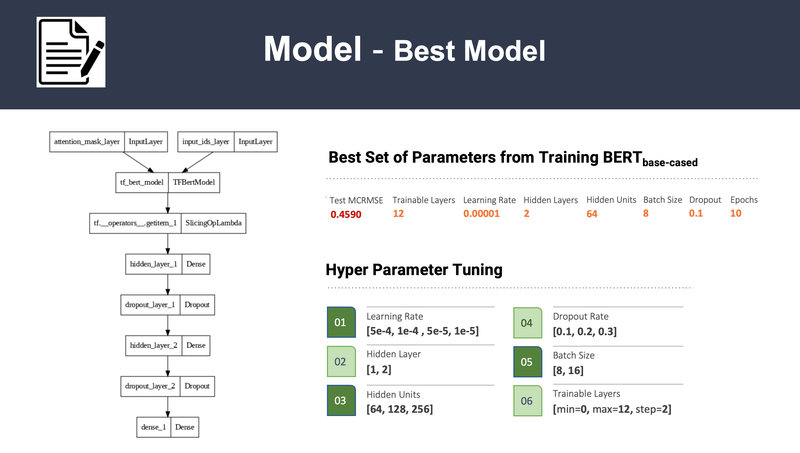
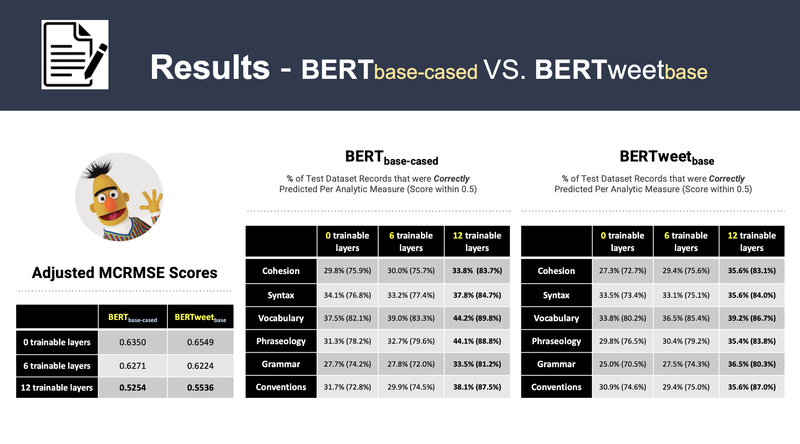
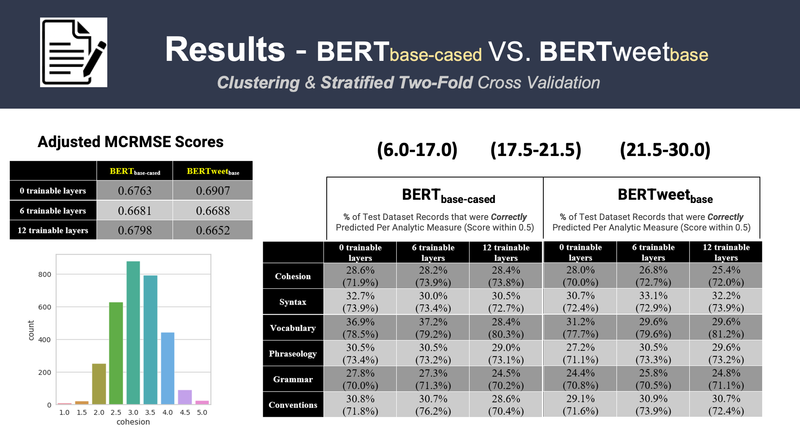
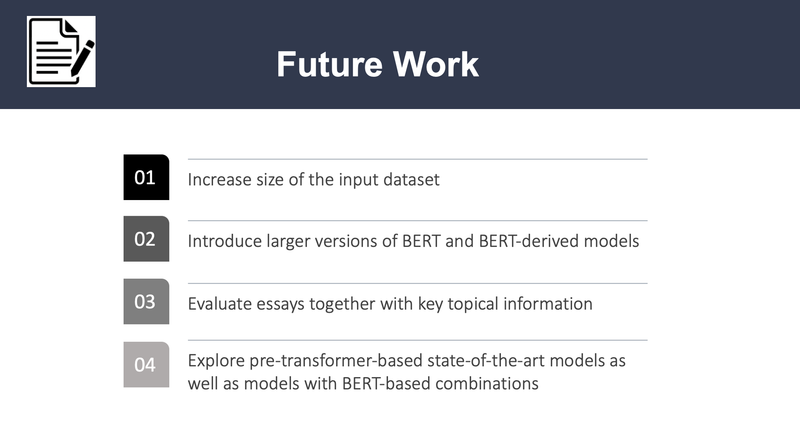
[https://github.com/srilamaiti/spring_2023_w266_final_project_heesuk_iris_srila] ► As a group project, we develop the Automated Essay Scoring (AES) system, the task of NLP technology to automatically assign scores to argumentative essays at scale particularly to help English Language Learners (ELLs) from grade 8-12. The essays have been scored according to six analytic measures: cohesion, syntax, vocabulary, phraseology, grammar, and conventions. Each measure represents a component of proficiency in essay writing, with greater scores corresponding to greater proficiency in that measure. The scores range from 1.0 to 5.0 in increments of 0.5. We feed student essays to BERT-based or BERTweet-based to train the AES system, capturing semantics and then map the representations to scores in the ordinal structure and constrain the calculated scores with MCRMSE regression loss. ► To improve the performance, we then employed K-means clustering with stratified two-fold cross validation on each of the BERT base models. Click the images below to enlarge.
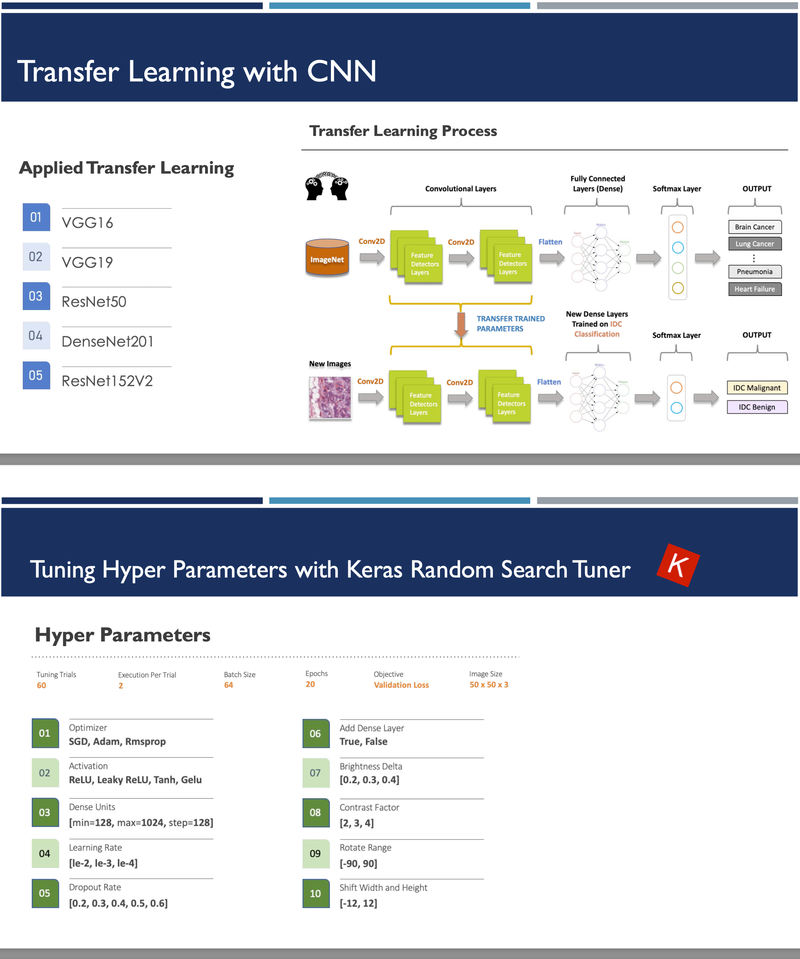
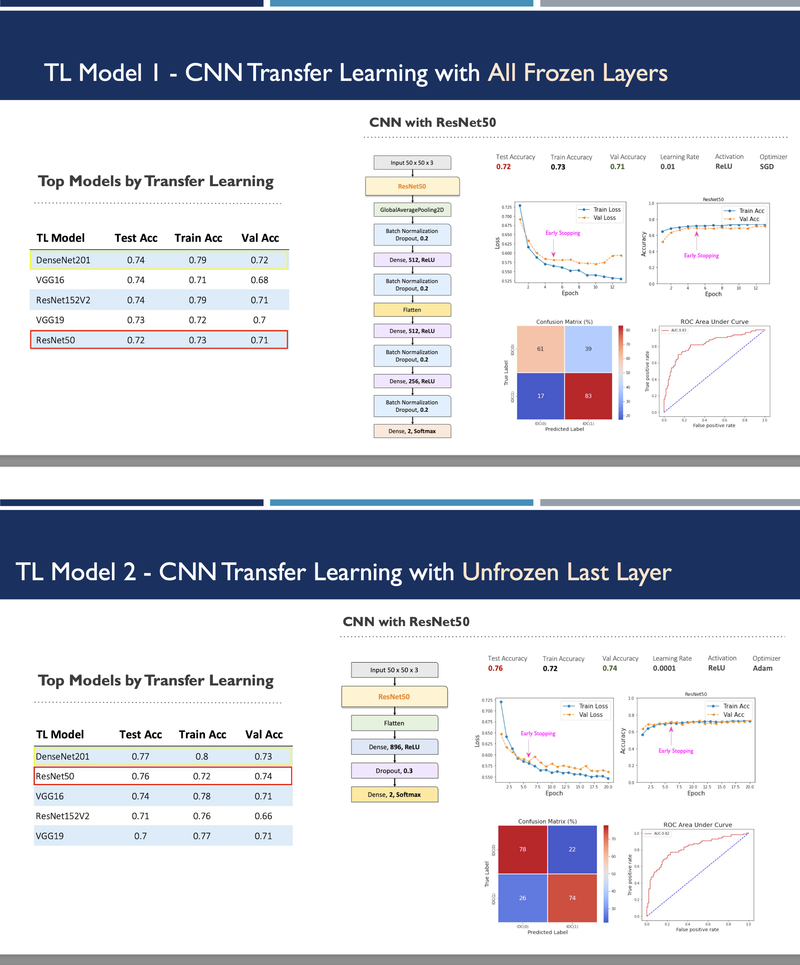
Invasive Ductal Carcinoma (IDC) Breast Cancer Classification - UC Berkeley, 2022
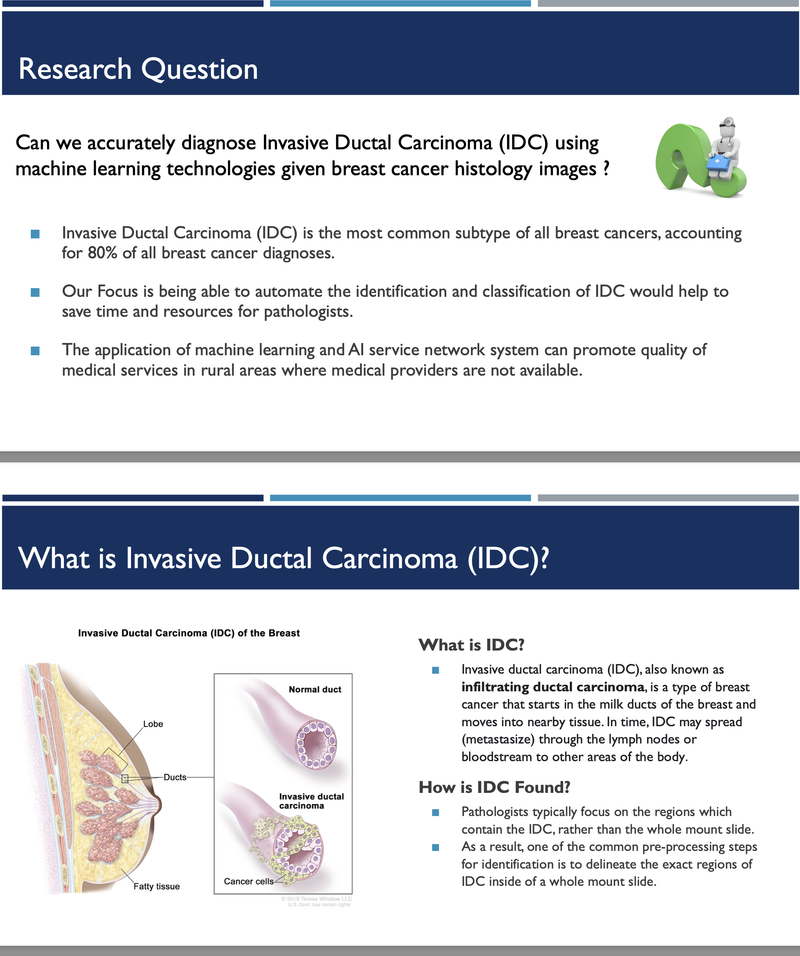
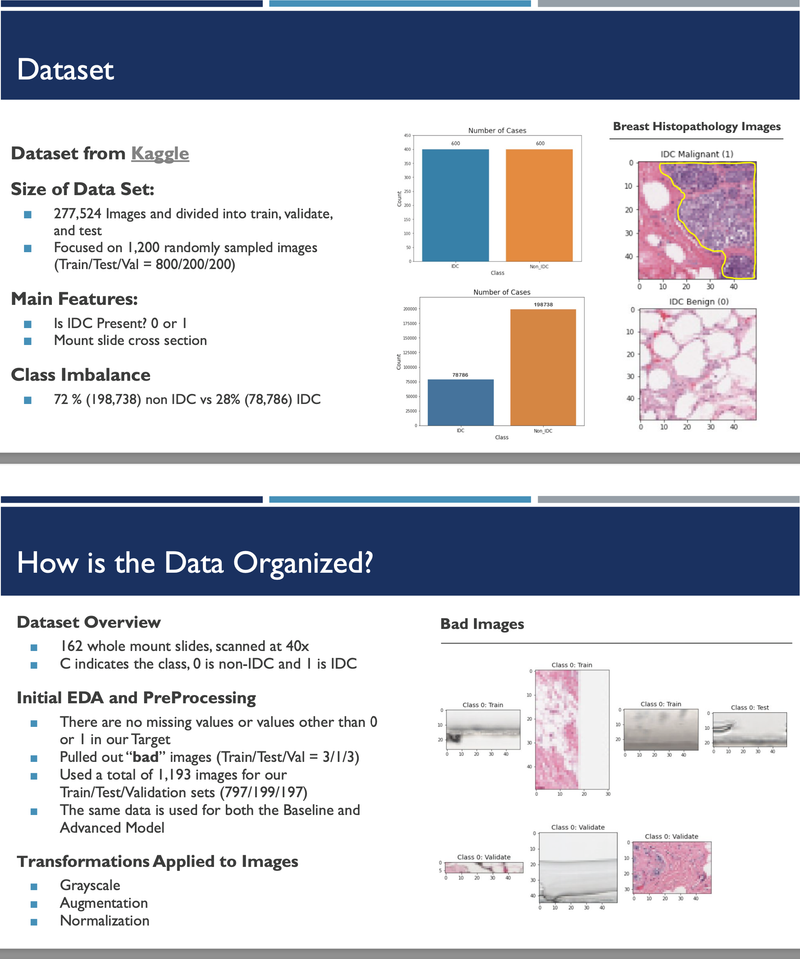
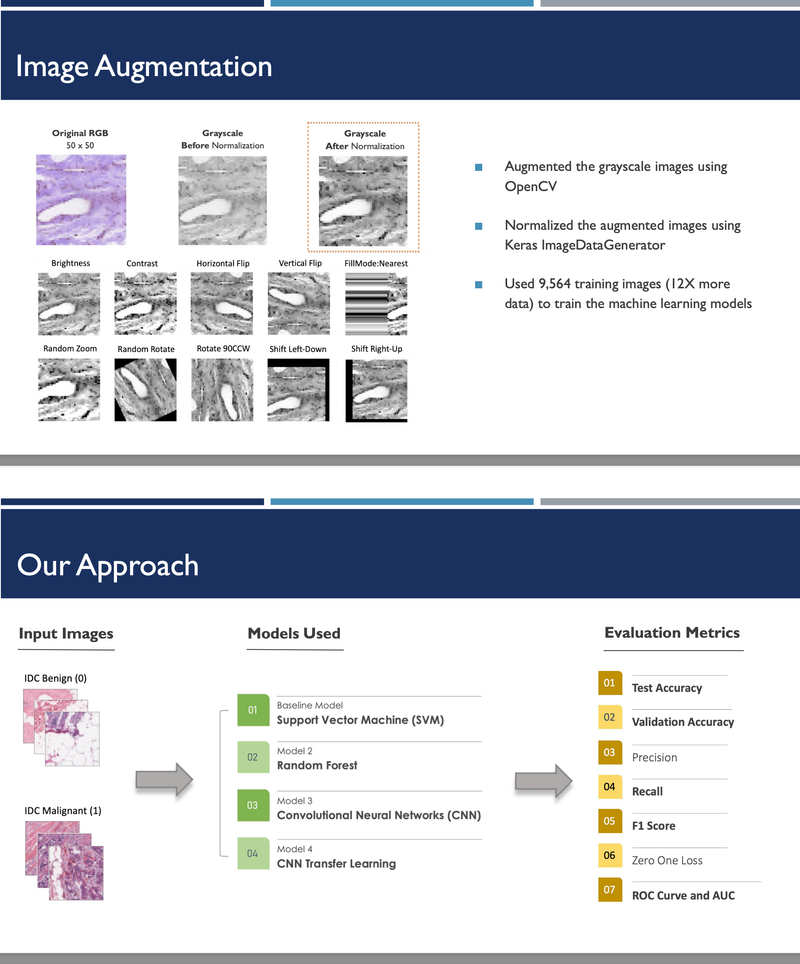
[https://github.com/heesukj/IDC-Breast-Cancer-Prediction] ► As a group project, we classified IDC Breast Cancer histopathology images into cancerous vs. non-cancerous. These images were obtained from the Kaggle website. We trained Support Vector Machine (SVM) as a baseline model and then four additional models with include Random Forest, XGBoost, CNN (Convolutional Neural Network), and CNN with transfer learning. As an individual contribution, I implemented CNN with five different transfer learning techniques (VGG16, VGG19, ResNet50, ResNet152V2, and DenseNet201) along with XGBoost and find the top models by different pre-trained techniques using the best hyperparameters determined by Keras Random Search Tuner. Click the images below to enlarge.
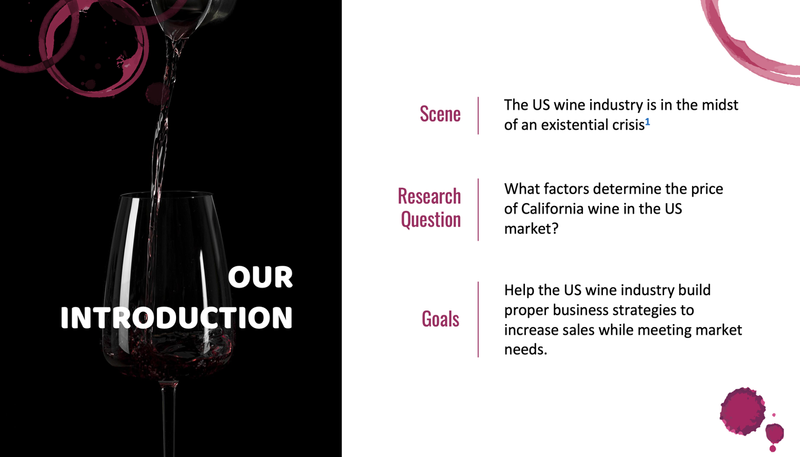
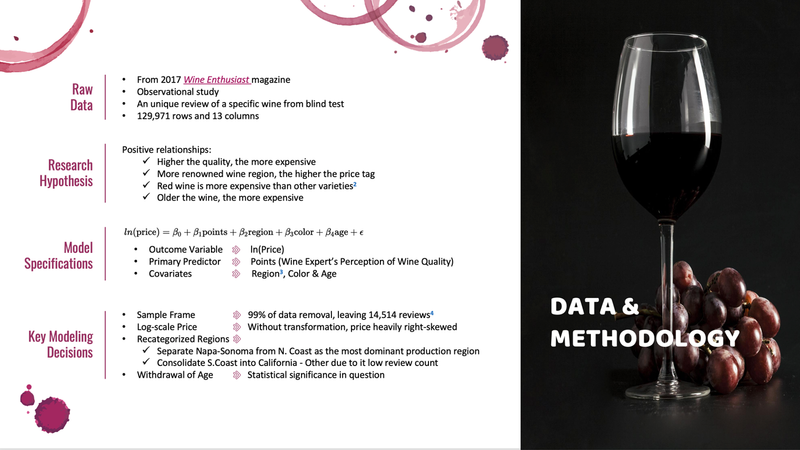
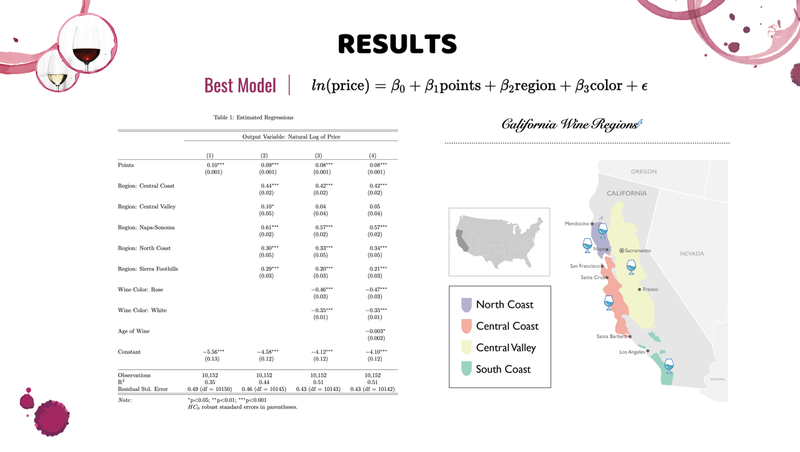
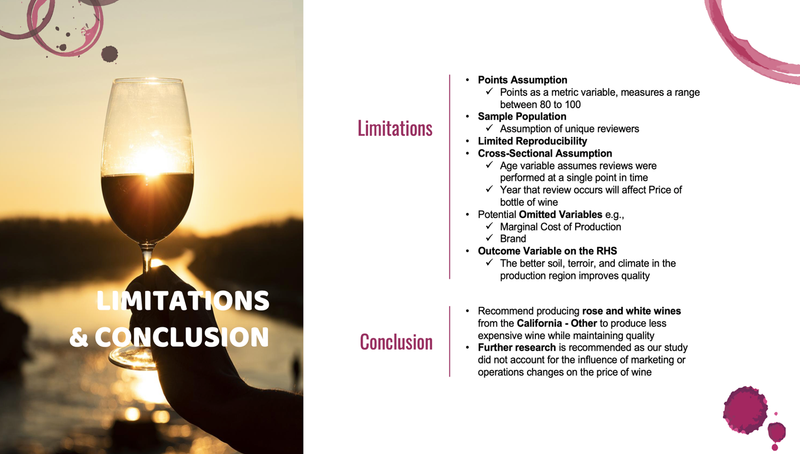
Evaluating Price Determinants of California Wine - UC Berkeley, 2022
[https://github.com/mids-w203/w203-lab2-team3/tree/main/reports] ► As a group project, we provided valuable insight into which factors contribute the most to the price of California wine in the US market, using R. With this information, we enabled the premium wine industry leaders in US to develop and implement data-driven business strategies and to strengthen an otherwise languid influence over the millennial consumer base. ► The results of this study would contribute to research efforts from a wider network of private and academic partnerships. Click the images below to enlarge.
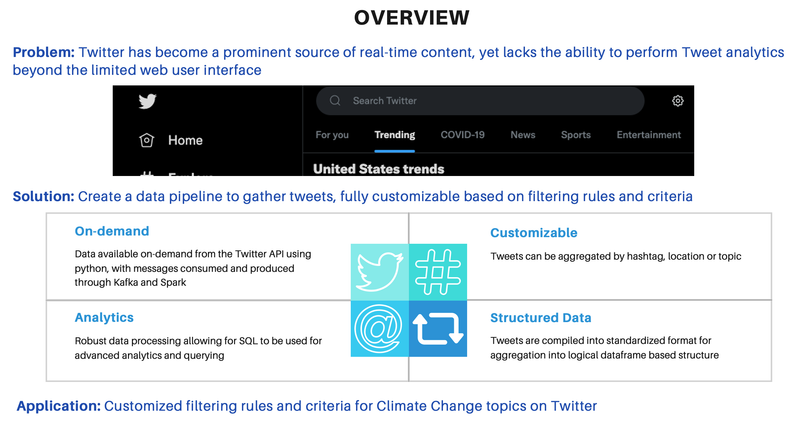
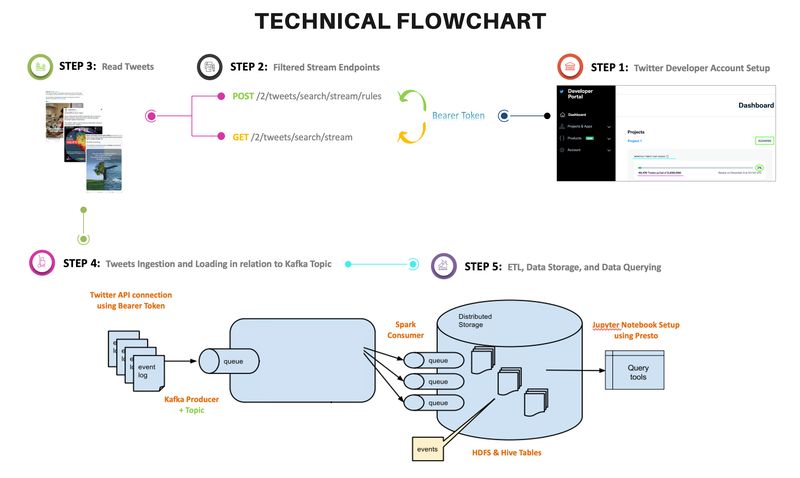
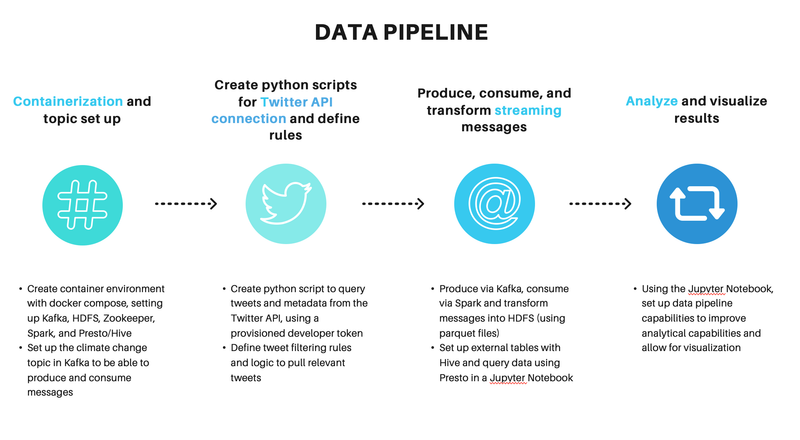
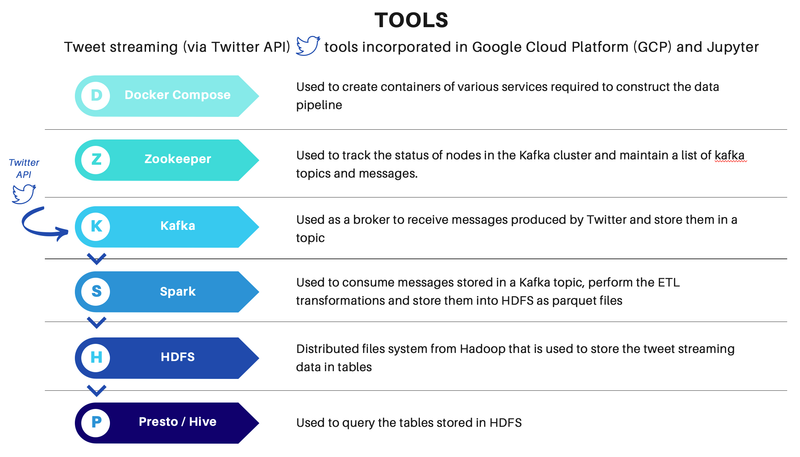
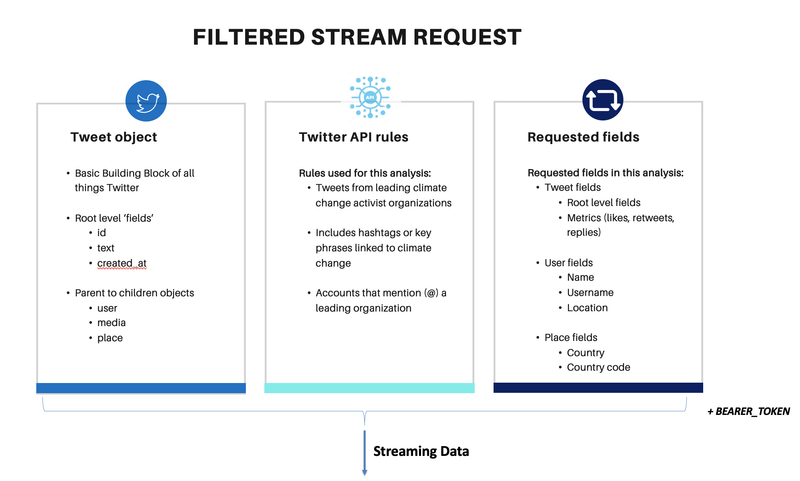
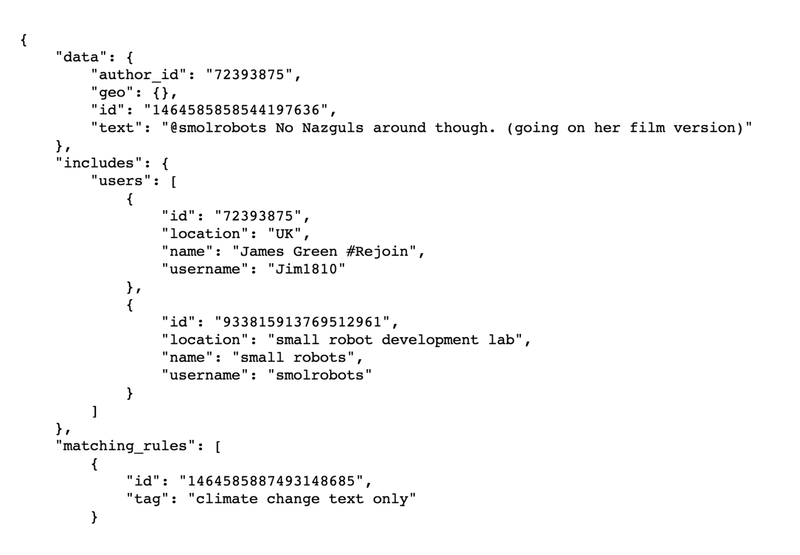
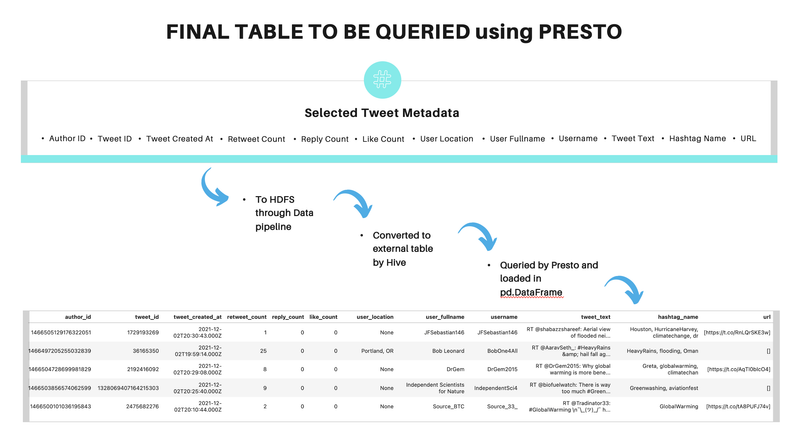
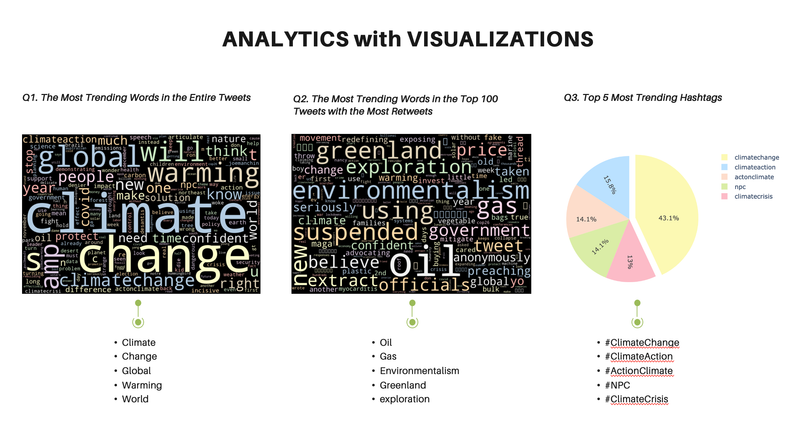
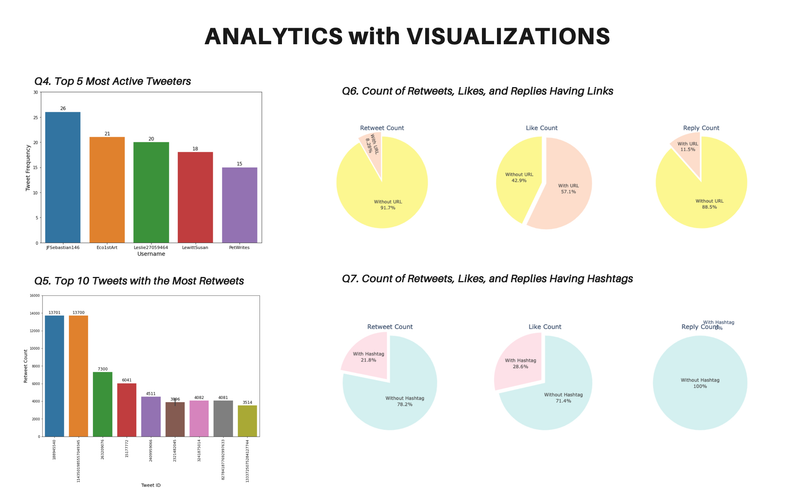
Streaming Climate Change data using Twitter API - UC Berkeley, 2021
[https://github.com/heesukj/twitter-climate-change] ► As a group project, I collaborated building a data pipeline capturing real-time tweets related to climate change using Docker, Kafka, Spark, Hadoop and Presto. ► As an individual contribution, I set an ETL pipeline , steaming the real-time tweets specific to climate change from Twitter's API using Docker and Kafka, storing the Spark dataframe to Hadoop, querying data using Presto and uncovering insights with visualizations using Python and Plotly. Click the images below to enlarge.
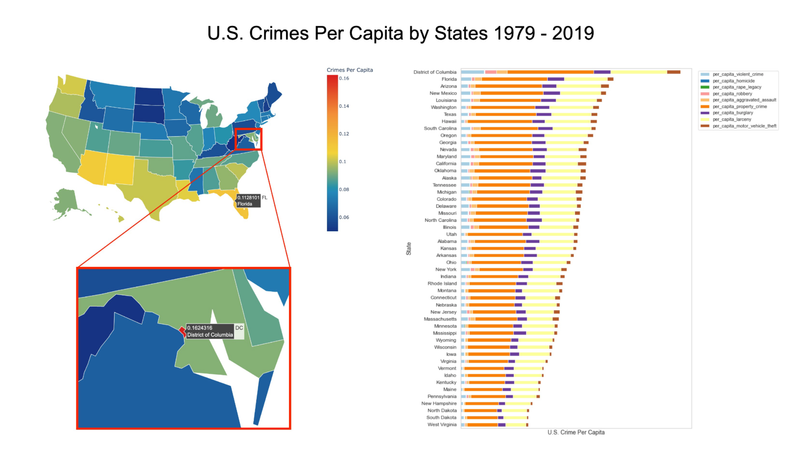
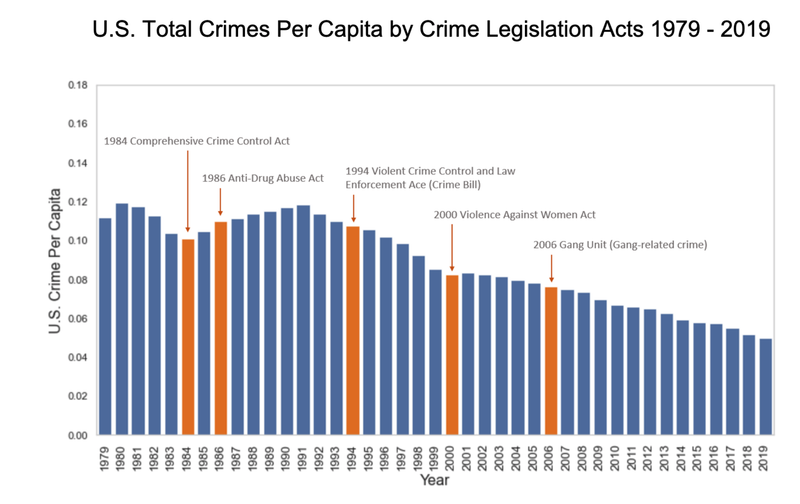
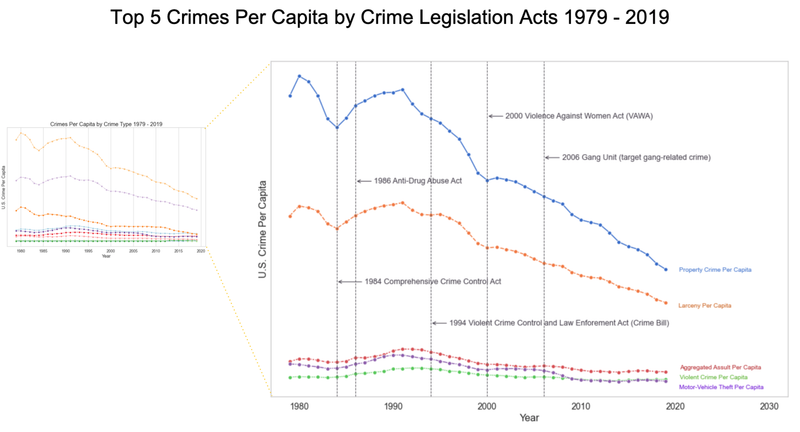
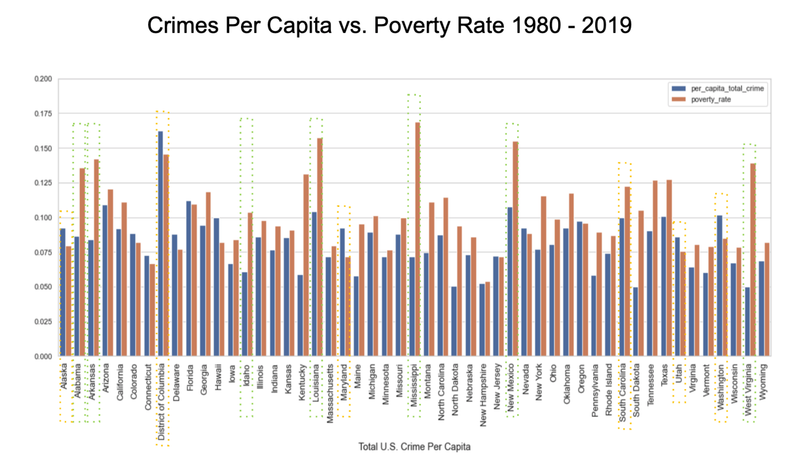
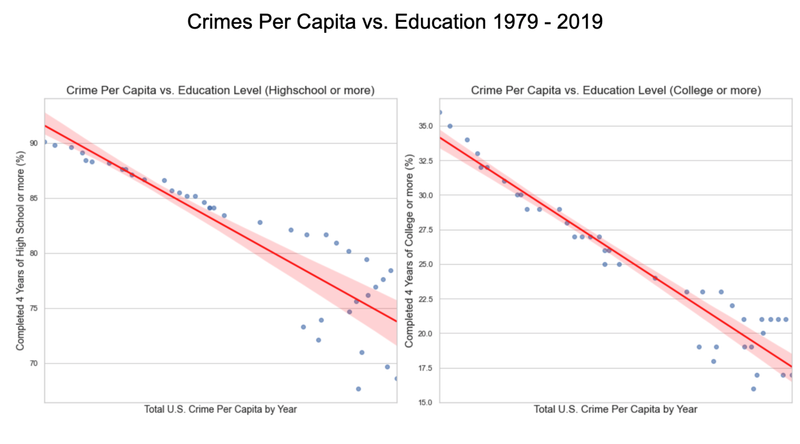
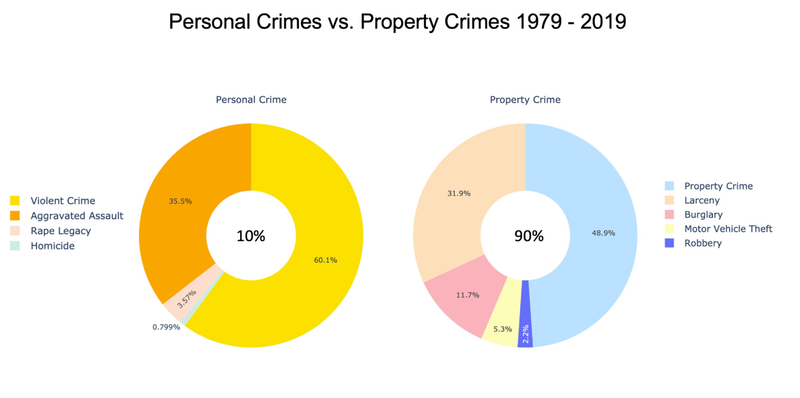
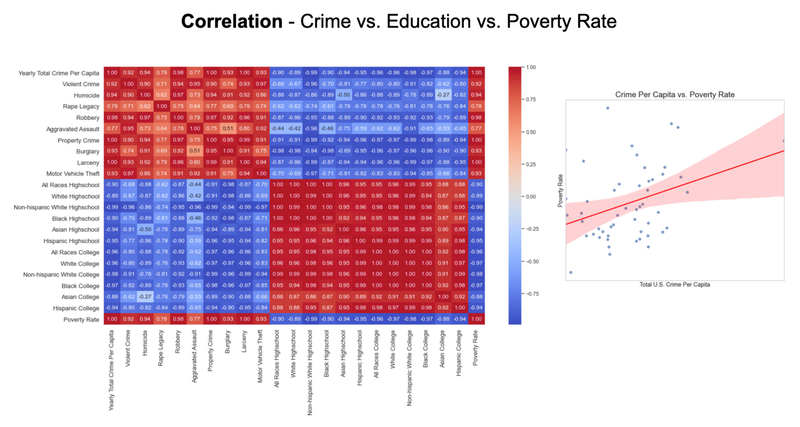
US Crime Analysis - UC Berkeley, 2021
[https://github.com/UC-Berkeley-I-School/Project2_Jang_Kuruvilla] ► As a group project, I focused on discovering some interesting historical patterns in the US crimes since 1979, providing analytical insights with the following visual representations. For example, I studied how different types of crime have been correlated with educational attainment and poverty rate as these socioeconomic factors are often reflected as one of the widely accepted dynamics on the shift in crime rate. Click the images below to enlarge.
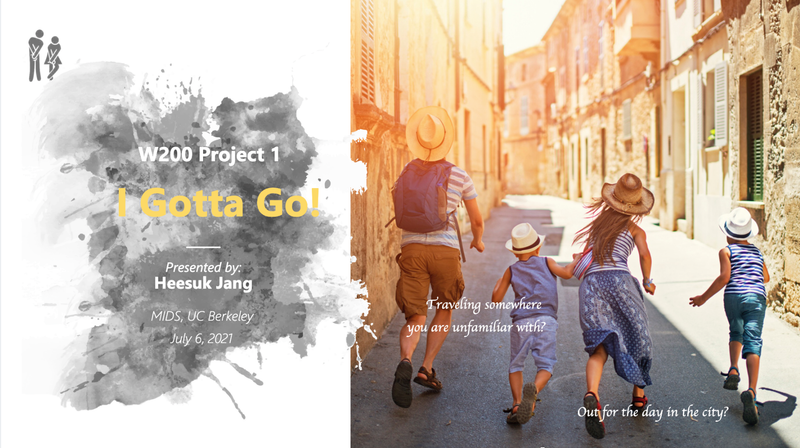
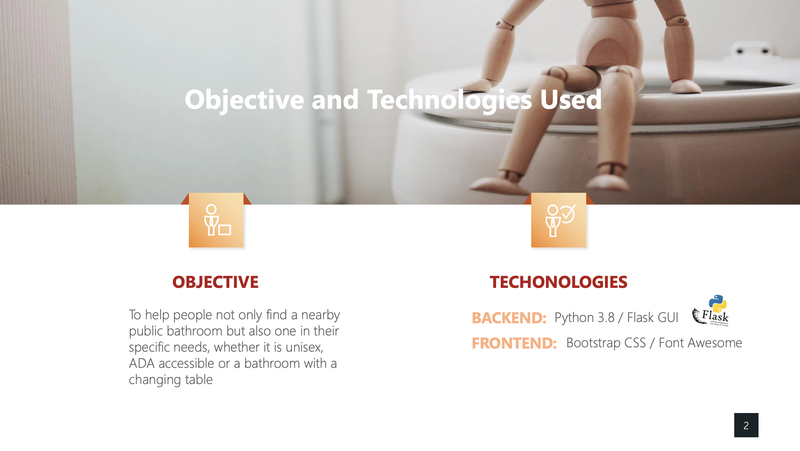
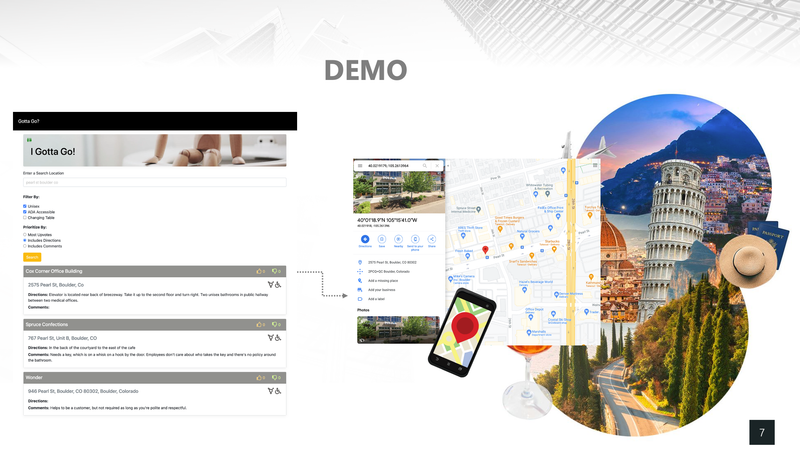
I Gotta Go! - UC Berkeley, 2021
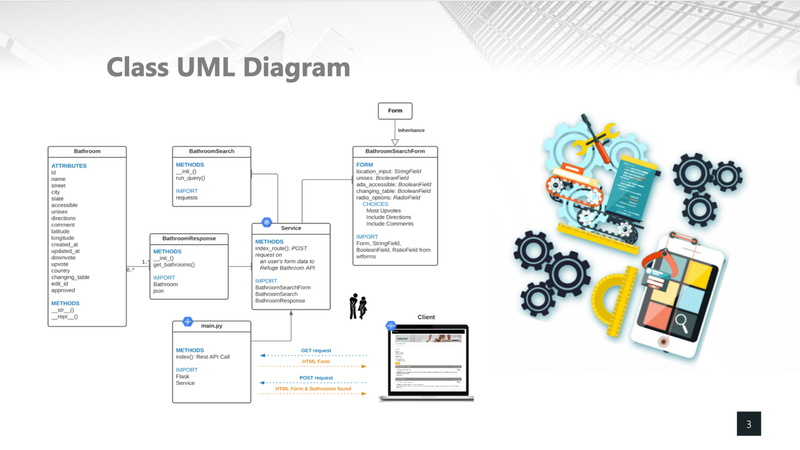
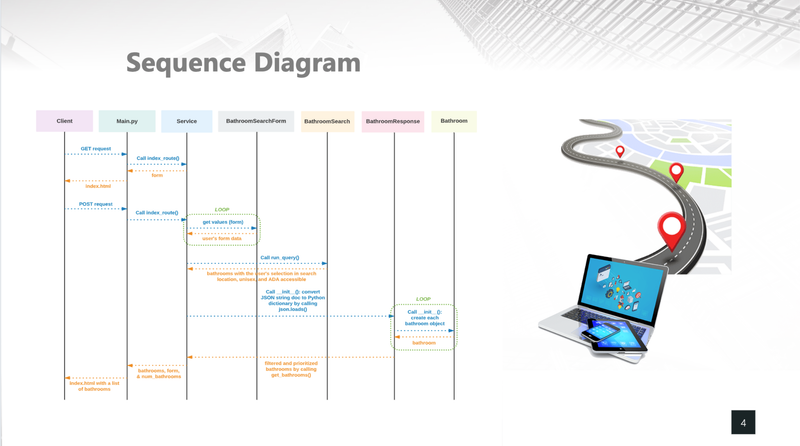
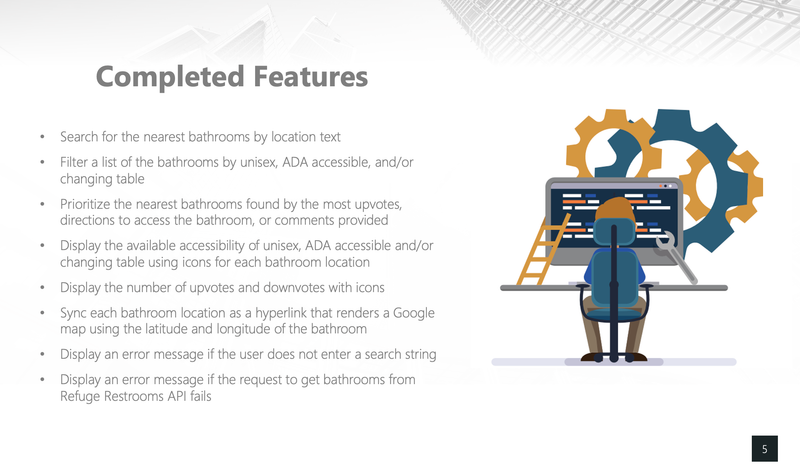
[https://github.com/heesukj/I-Gotta-Go-application] ► As an individual project, I built a web application that provides directions to the nearest public bathroom. Search results are based on location and directions are provided by Google maps. Bathrooms can be filtered by unisex, ADA accessible and/or changing table and prioritized by the most number of upvotes. Click the images below to enlarge.
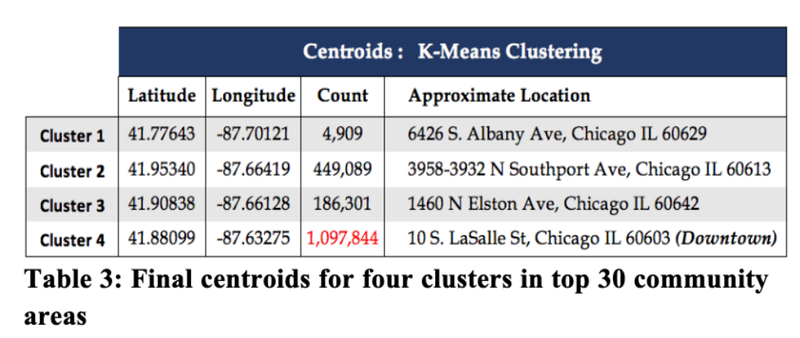
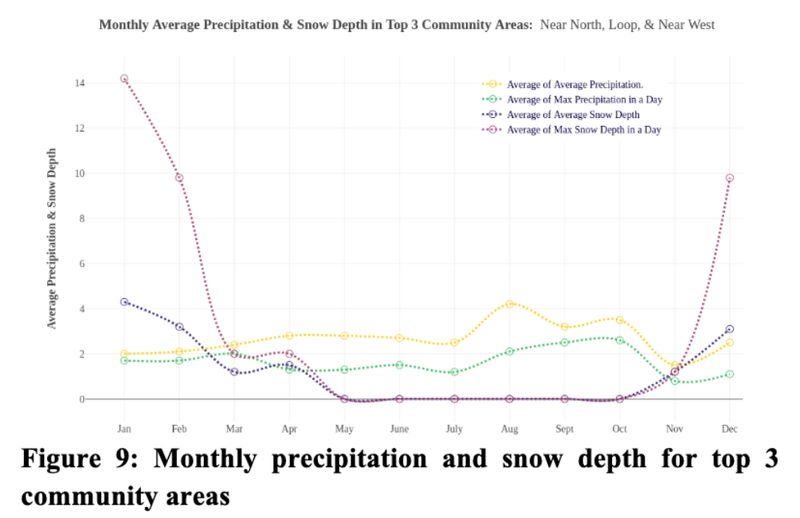
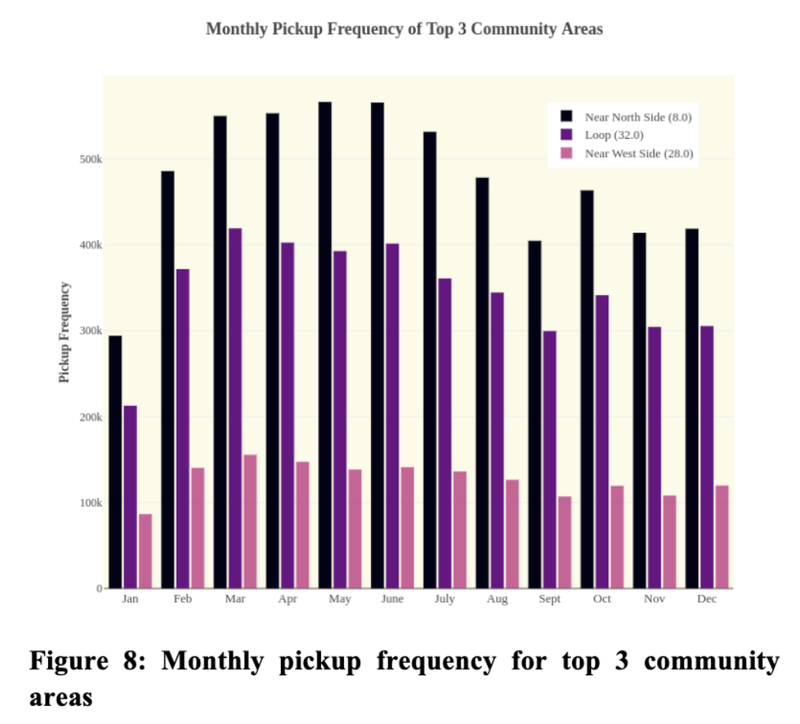
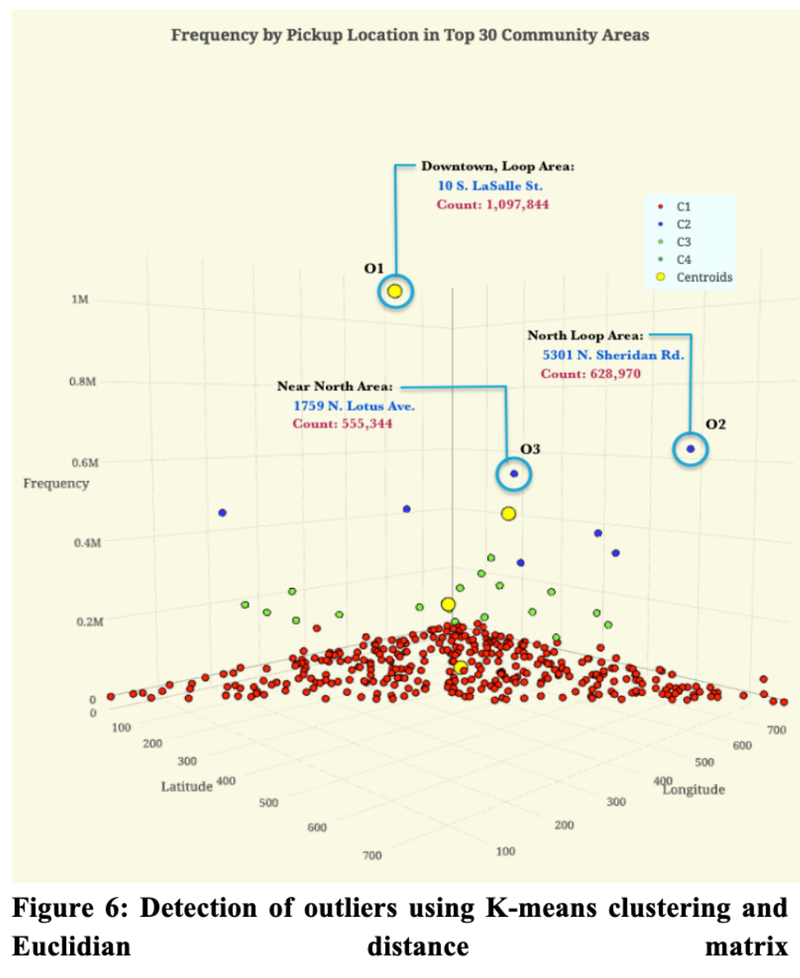
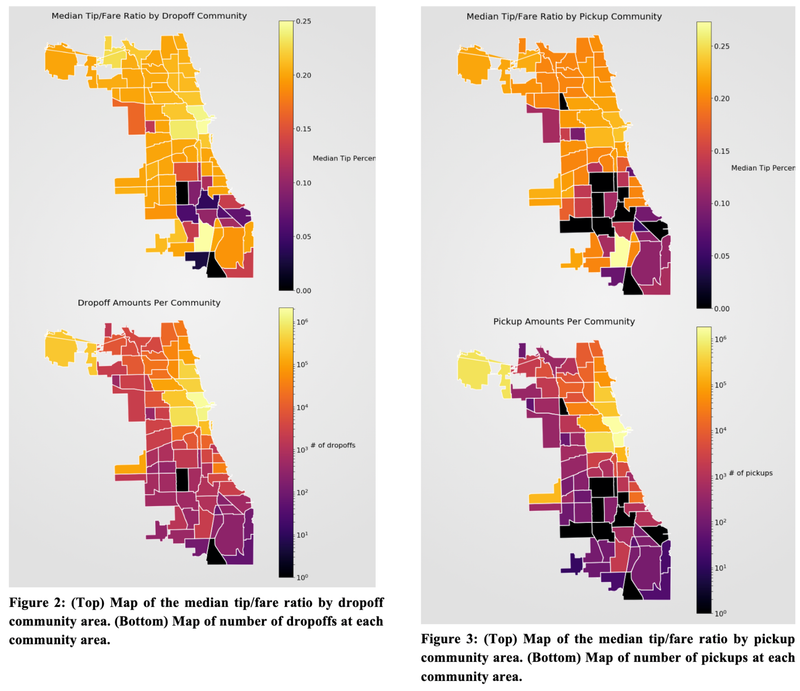
Predicting Chicago Taxi Pickup Hotspots - CU Boulder, 2018
[https://github.com/heesukj/csci4502_DM_project] ► As a group project, I provided the following analysis by applying K-Means clustering with Elbow method and Euclidean distance function to predict taxi pickup hotspots with a 95% accuracy. ► Conducted a correlation and regression analysis of the relationship between pickup frequency and relevant factors such as weather, date/time, and income that could affect the prediction for the best tips and pickup frequency in different areas of Chicago. Click the images below to enlarge.